We built NASEBANAL Quickstarts for use in training as part of NASEBANAL's consulting services, and publish it as open source. This post walks through its overview across three sample scenarios: running the test suite, switching to mocks through Kong, and measuring the payoff of async messaging with Kafka.
Why we built NASEBANAL Quickstarts
AI coding agents are spreading fast, and handing off implementation work by describing requirements to them is becoming routine. But hand an AI too large a requirement at once, and it stumbles the same way a person does — details get missed, scope gets muddled. Breaking requirements into smaller, clearly-bounded pieces is, I think, part of why architectures like microservices are getting a fresh look.
At the same time, the more services you have, the more quality management matters. At NASEBANAL, we're proposing a quality strategy built from four broad categories of test tooling: unit tests with tools like Vitest and pytest, E2E tests with tools like Playwright, contract testing with tools like Specmatic and Microcks for shifting left, and load testing with tools like Locust. On top of that, we make it possible to try out the pieces that are specific to microservices architectures themselves — an API gateway (Kong), event streaming (Kafka) — hands-on, too.
I've noticed that software quality and architecture practices vary wildly by vendor, and even project to project — often boiled down to whatever one person happens to know. That's exactly why standardizing the test strategy, the tooling, and how test results get managed matters: it's what actually raises the floor on software quality overall, not just on any one project.
That said, building a microservices architecture surfaces concepts a monolith never made you think about. Event streaming (Kafka), an API gateway (Kong), service discovery (Consul), and contract testing (Specmatic) or API mocking (Microcks) are typical examples, and adopting the right tool for each of these genuinely matters. But the more tools you add, the more each one's install steps, start/stop commands, and admin-console access all diverge — and that's not something anyone can keep memorized. We built NASEBANAL Quickstarts (repository name: nb-quickstarts), an open-source tool NASEBANAL publishes, to absorb that "every tool does it differently" problem.
NASEBANAL Quickstarts' structure and features
Every module is driven by the same Docker Compose call — make <module>:up / make <module>:down — and any tool with an admin console opens it straight from make <module>:open. Its focus, for now, is the technologies that make up the NASEBANAL Stack — carving out each piece as its own module.
It also ships a sample test-target app (the apps module), so tools like Playwright or Locust are ready to try against something real, right away. And once you're done, make <module>:down cleans up after itself — no leftover cruft to worry about.
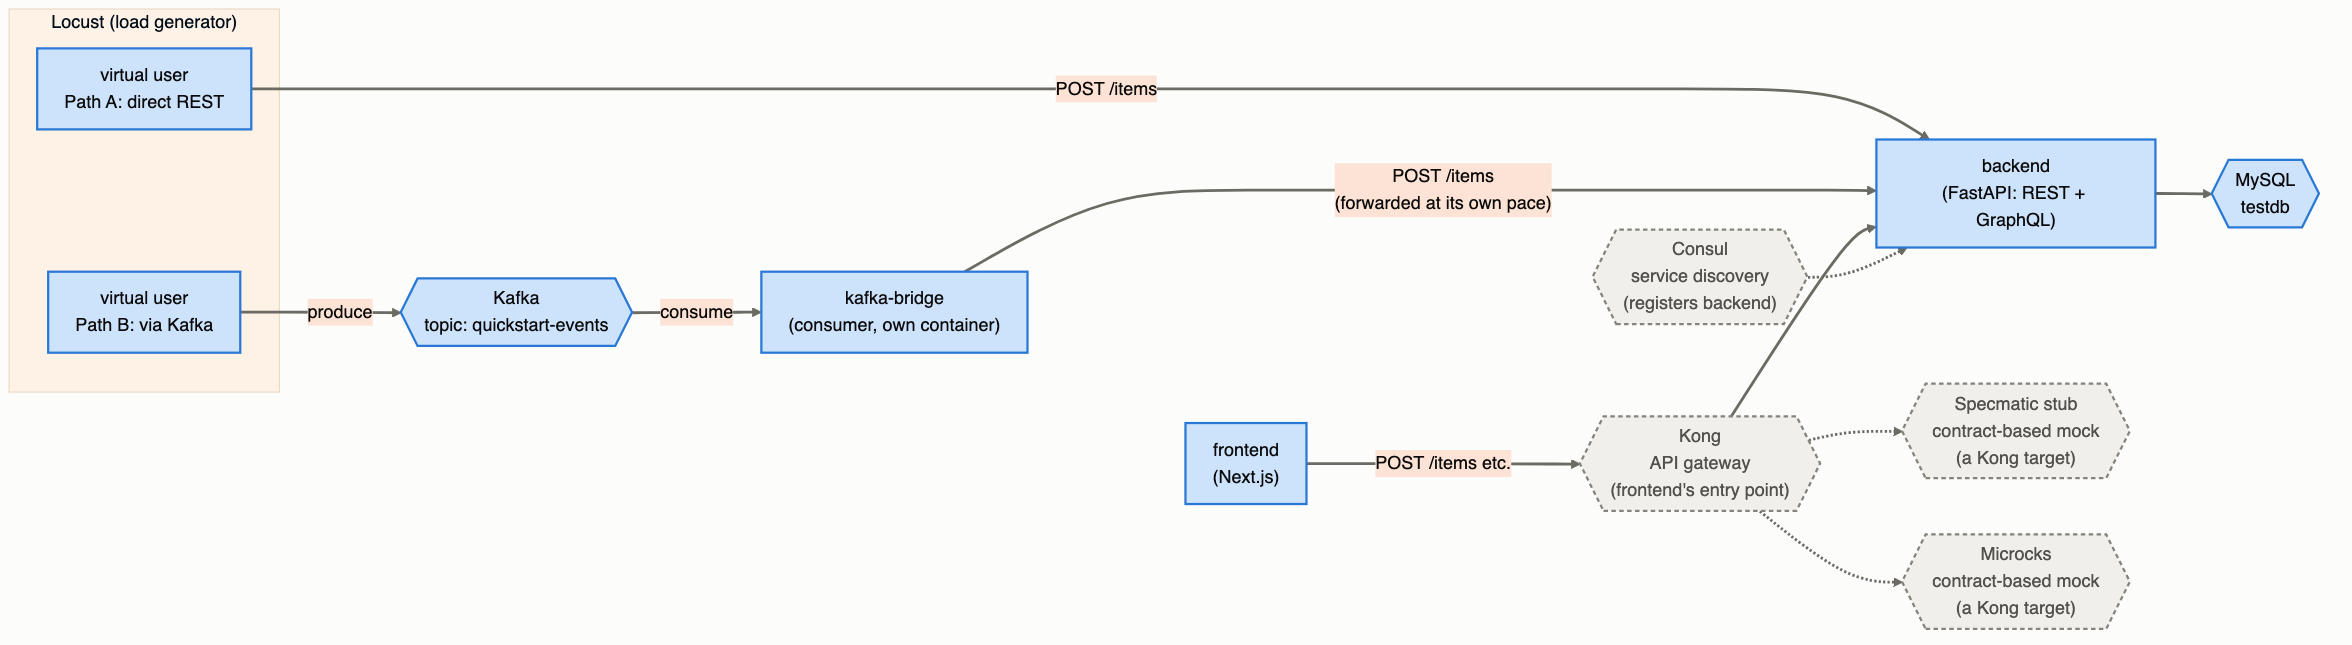
Here's the overall picture. Centered on the apps module (frontend, backend, MySQL), the Kong API gateway, Kafka plus kafka-bridge (which converts between async and sync), and Specmatic/Microcks (contract testing and API mocking) all sit on the same network and can be freely combined. The three scenarios below use the test-tooling group, Kong + mocks, and Kafka + Bridge respectively.
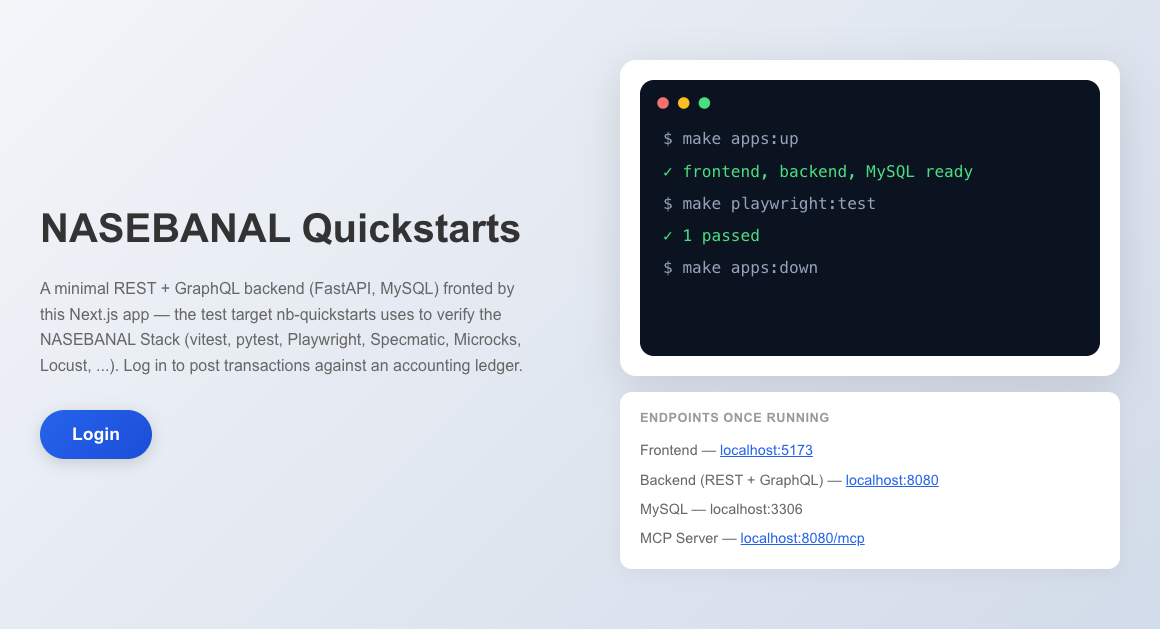
The sample test-target app
Here's what the apps module's landing page looks like — a simple accounting-ledger app where logging in is a single modal.
Once logged in, you get a balance table per account and a form to record a new transaction. The accounts table models a simple accounting ledger / event-sourced design: name is an account (e.g. "Cash"), and each row is one transaction posted against it (quantity is a signed debit/credit delta) — the balance shown on screen is just the running sum of an account's own entries.
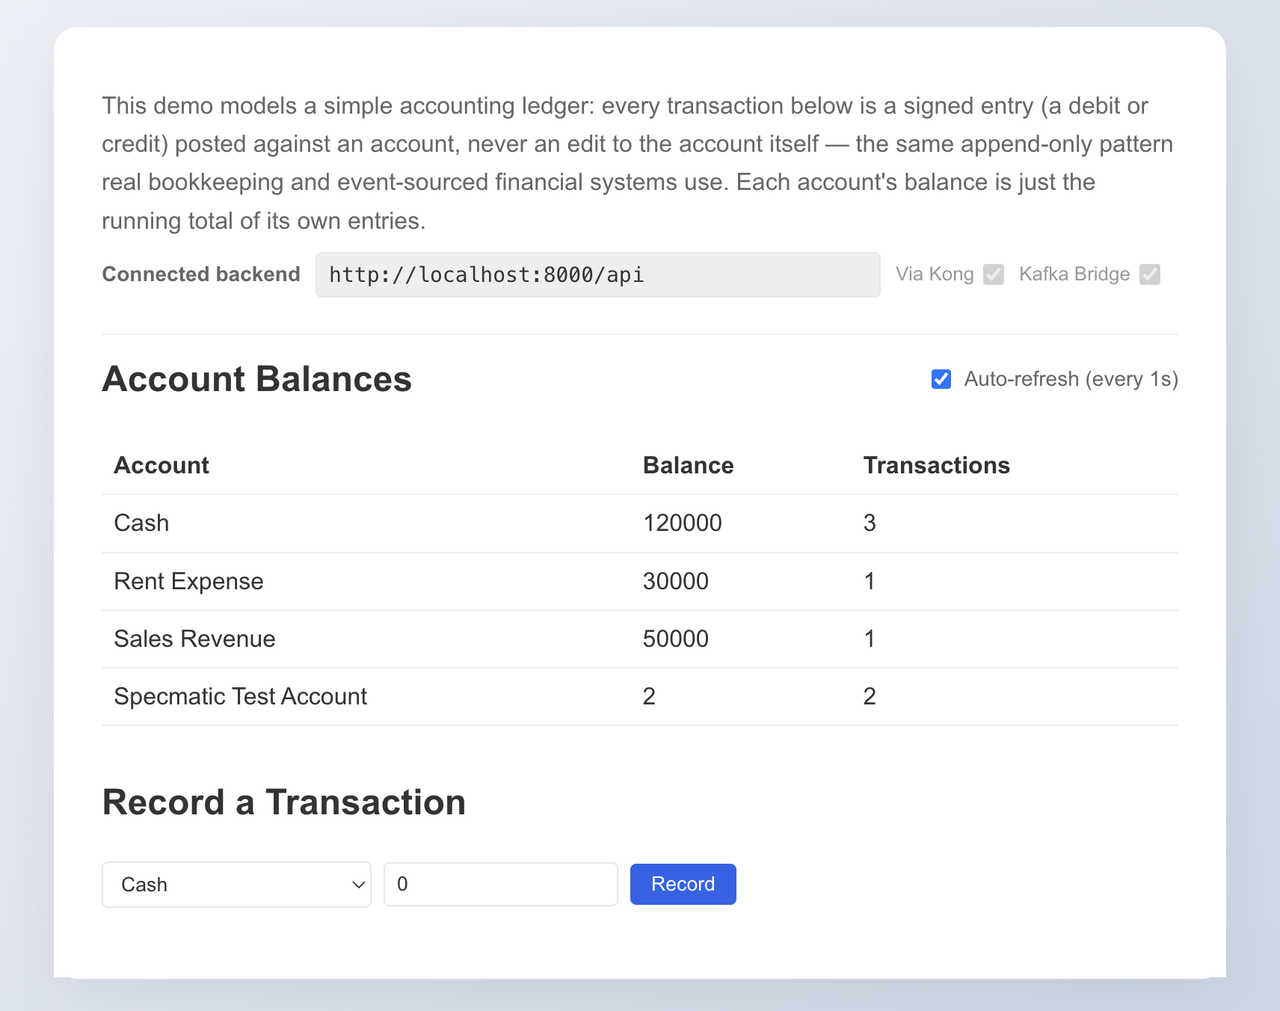
Writing to this backend (POST /accounts) is the exact target that all three scenarios below keep coming back to.
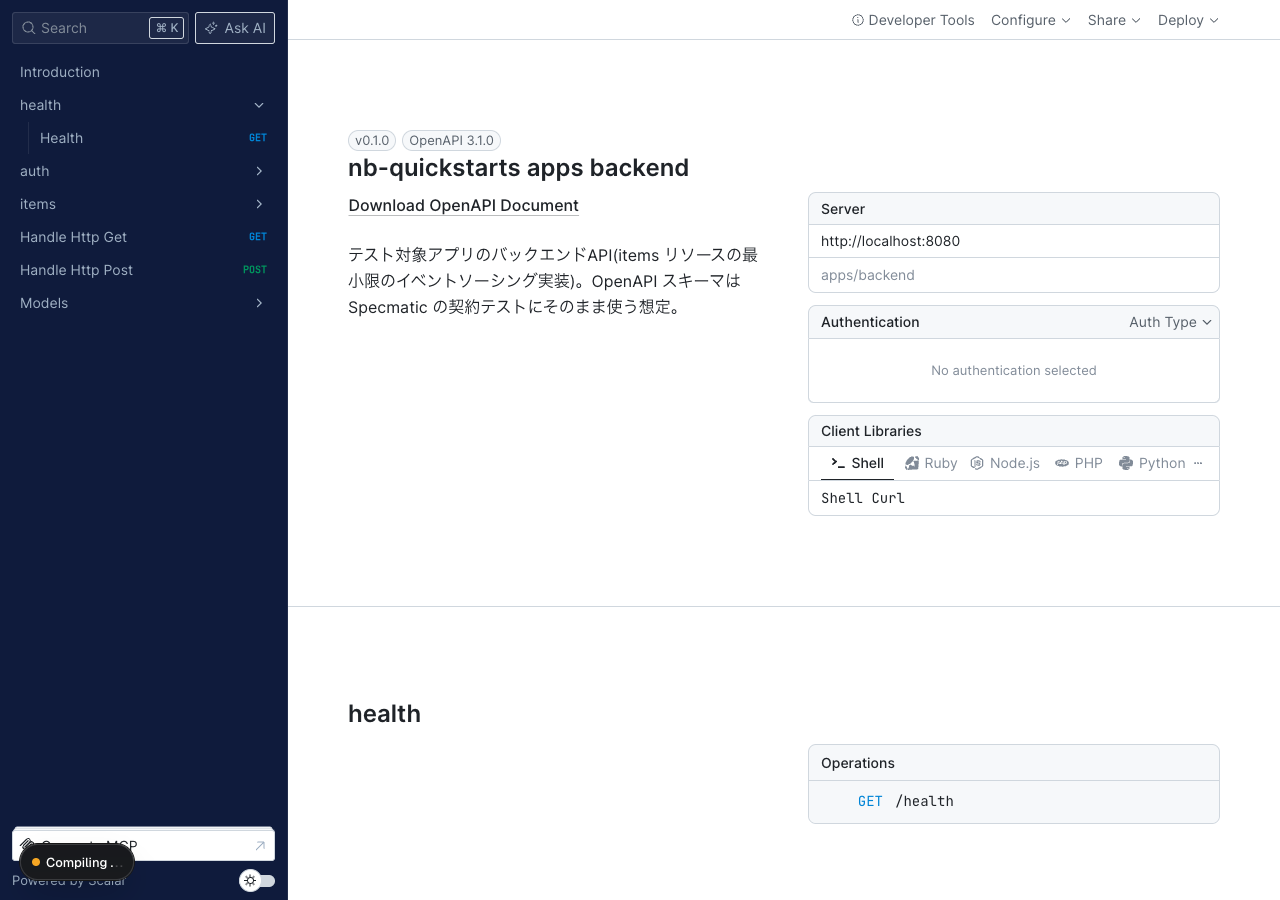
apps/backend itself doesn't check an OpenAPI schema file into the repo generated from its code — it hand-maintains one (apps/backend/openapi.yaml) and serves it verbatim at /openapi.json. Contract-Driven Development is an approach where the API's caller (the Consumer) and its provider (the Provider) first agree on a shared contract — here, an OpenAPI spec — and then each side develops against it independently, spinning up mocks with tools like Specmatic and Microcks to test against along the way. Both Specmatic and Microcks pull that schema straight from the live backend as the source for their contract tests and mocks, and the frontend's /api-specs page renders that very same schema with Scalar.
This time, we ran three sample scenarios using NASEBANAL Quickstarts:
- Test execution — run unit, contract, E2E, and load tests, and look at the reports each one leaves behind
- Switching to Kong-routed mocks — switch the frontend's connection over to the Kong API gateway, then swap the target behind it out for Specmatic and Microcks mocks and confirm it works
- Measuring the payoff of async messaging — introduce Kafka+Bridge async ingestion, then compare how Locust's load-test results change between hitting REST directly and going through Kafka
Sample scenario 1: test execution — unit, contract, E2E, and load tests, and their reports
First, let's actually run all four kinds of tests. The point of NASEBANAL Quickstarts is that every one of them can be run the same way — a single make <module>:test, no container left running afterward.
make apps:up                # start the apps under test first

make pytest:test            # apps/backend unit tests (in-memory SQLite, apps:up not required)
make vitest:test            # apps/frontend unit tests (fetch mocked, apps:up not required)
make playwright:test        # E2E browser test against the running frontend (requires apps:up)
make specmatic:test         # Provider contract test: does the backend honor apps/backend/openapi.yaml? (requires apps:up)

make specmatic:stub-up      # mock server built from the same contract (requires apps:up)
make vitest:contract-test   # Consumer contract test: does the frontend's API usage hold up against it?
Each run leaves its own HTML report behind, as follows. All of these are gitignored — they're regenerated fresh on every run, not checked in.
| Module | Report |
|---|---|
pytest | pytest/report/report.html (pytest-html, self-contained) |
vitest | vitest/report/index.html (Vitest's built-in html reporter) |
vitest:contract-test | vitest/report-contract/index.html (same reporter, separate output dir) |
playwright | playwright/report/index.html (Playwright's built-in html reporter) |
specmatic | specmatic/report/html/index.html, plus specmatic/junit/TEST-junit-jupiter.xml (JUnit format) |
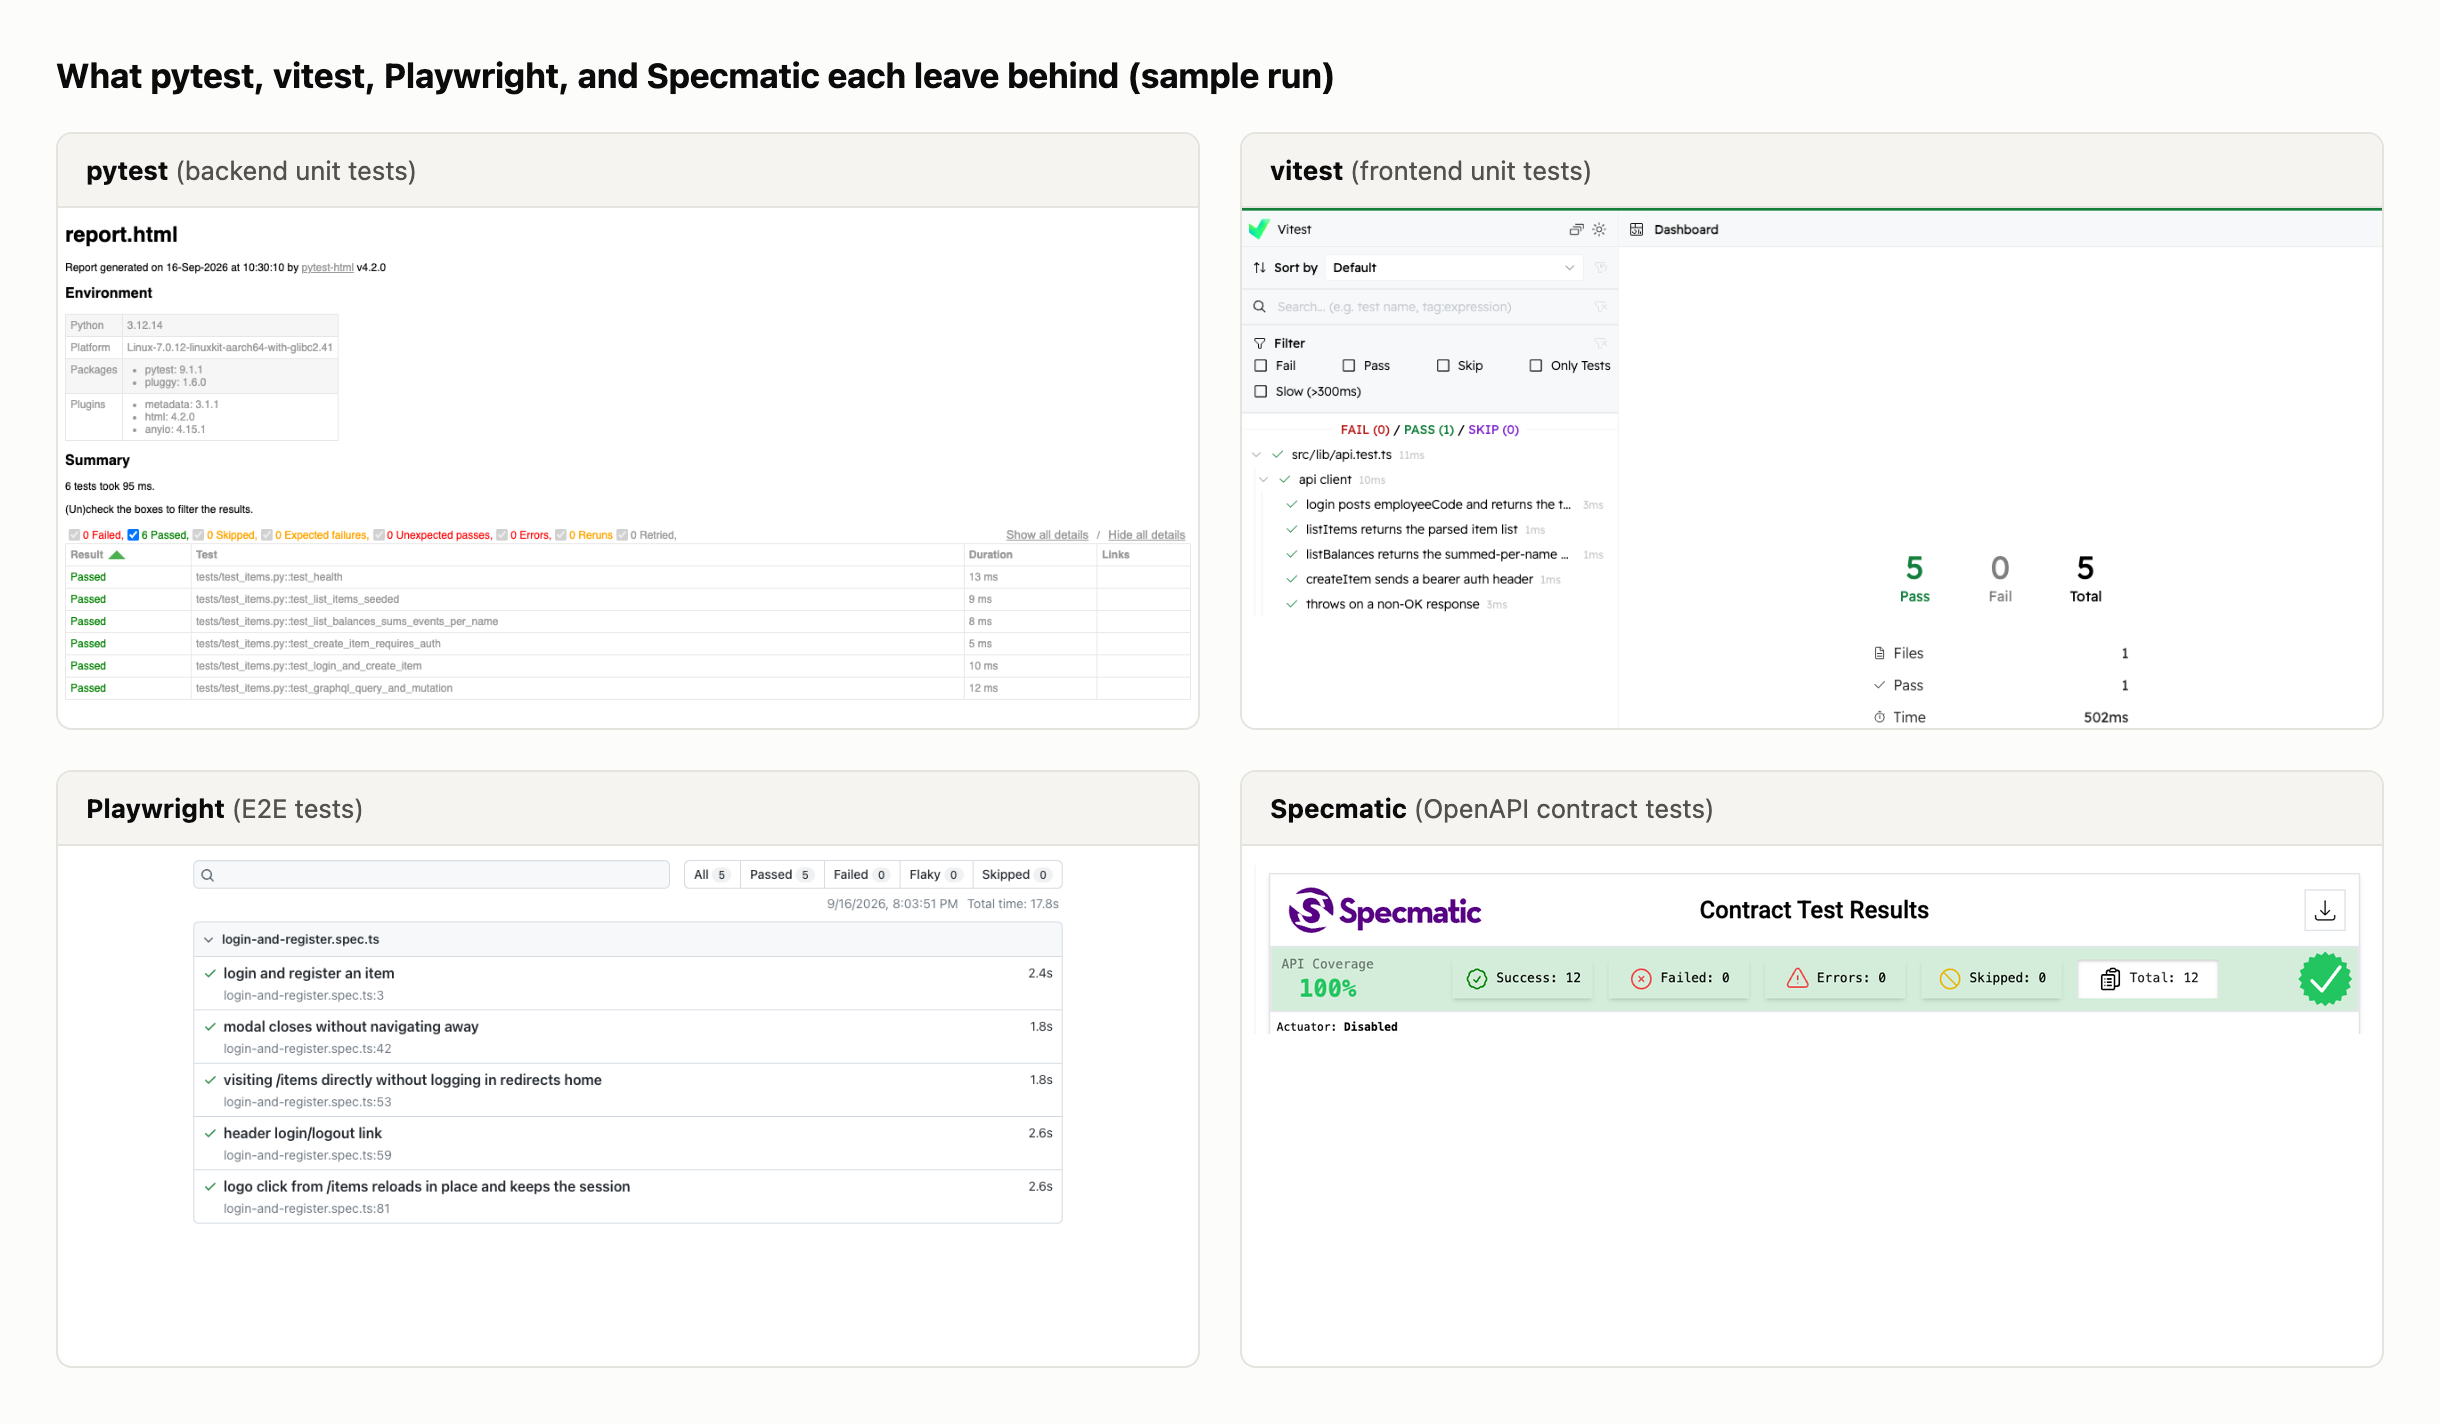
Specmatic's contract test is worth calling out for checking the contract from both directions. specmatic:test is the Provider-side test — does the real, running backend actually honor the contract? specmatic:stub-up + vitest:contract-test is the Consumer-side test — does the frontend's real api.ts code hold up against a mock built from that same contract? Both start from the same openapi.yaml, so a drift in the contract has two independent chances to get caught.
Load testing with Locust works a little differently: instead of a single HTML file, each run leaves behind a whole timestamped directory (locust/logs/YYYYMMDD_HHMMSS/):
target_host.txt— the run's own configuration (target host, locustfile, tags, worker count)result.log/master.log— execution logslocust_stats.csv/locust_stats_history.csv— aggregated and time-series statisticslocust_failures.csv/locust_exceptions.csv— failure and exception recordsreport.html— the final report
Because the run's own parameters (target, duration, tags, and so on) are captured alongside the results, there's never any doubt later about which conditions a given report came from. We'll dig into the substance of these load tests in scenario 3 below.
Sample scenario 2: integration through Kong — swapping in Specmatic and Microcks mocks
Next, let's route the frontend's connection through the Kong API gateway, and then swap what's behind it out for a mock instead of the real backend.
make kong:up
# .env: NEXT_PUBLIC_API_BASE=http://localhost:8000/api
make apps:restart   # frontend needs recreating - Next.js dev mode bakes NEXT_PUBLIC_* into the bundle at server start
The apps_backend service defined in kong/conf/declarative.yml proxies http://localhost:8000/api/* to the backend's own root (strip_path: true, so /api/accounts reaches backend:8080/accounts). That one service's target is the single seam to work with — repoint it at a mock built from the same contract instead of the real backend, and neither the frontend nor any test hitting /api/* needs to change at all.
| Target | Host (in-network) | Port | Path prefix |
|---|---|---|---|
| Real backend | backend | 8080 | (none) |
| Specmatic's stub | specmatic-stub | 9091 | (none) |
| Microcks | microcks | 8080 | /rest/nb-quickstarts+apps+backend/0.1.0 |
Switching to Specmatic's stub — the same mock vitest:contract-test uses above, now reachable through Kong too.
make apps:up
make specmatic:stub-up
# kong/conf/declarative.yml: change apps_backend's url to http://specmatic-stub:9091
make kong:reset
curl http://localhost:8000/api/accounts/1   # -> Specmatic's stub, not the real backend
Switching to Microcks — this one mocks the read side (GET /health, GET /accounts, GET /accounts/balances, GET /accounts/{account_id}, POST /auth/login) using the example values baked into openapi.yaml. POST /accounts needs a real bearer token, which an OpenAPI example has no way to carry (it's a header, not part of the request body), so it's out of scope here. Microcks' own mock URL has a different shape than the real API (/rest/<service>/<version>/<path>, with the service name space-encoded as +), so apps_backend's target needs that whole prefix baked in — Kong then just appends whatever's left after stripping /api.
make apps:up
make microcks:up
make microcks:import-openapi
# kong/conf/declarative.yml: change apps_backend's url to http://microcks:8080/rest/nb-quickstarts+apps+backend/0.1.0
make kong:reset
curl http://localhost:8000/api/accounts/balances   # -> Microcks' mock, not the real backend
Neither swap was just something we ran once and moved on from — both were actually verified. With the frontend routed through Kong, running playwright:test showed every one of those requests hitting /api/* in Kong's own access log, and with apps_backend pointed at each mock in turn, curl returned exactly the example values from openapi.yaml, confirmed against Microcks' and Specmatic's own request logs too. Afterward, apps_backend's url goes back to http://backend:8080 and a make kong:reset puts things back to targeting the real backend.
You can make the same swap from Kong Manager's screen instead of editing declarative.yml by hand — this needs KONG_DB=postgres (make kong:up KONG_DB=postgres, or set it in .env), since DB-less mode's Admin API is read-only: Kong Manager can display apps_backend but can't save an edit to it. In Postgres mode, editing the one apps_backend service through the UI takes effect immediately, no kong:reset needed.
make kong:open(or open http://localhost:8002) → Gateway Services →apps_backend→ Edit.- Change Host (and Port, and Path for Microcks) to point at the mock, then Save.
curl http://localhost:8000/api/accounts/balances(or reload the frontend if it's routed through Kong) to confirm the mock is answering — allow a couple of seconds for the change to propagate to Kong's own worker processes first.- To revert: edit
apps_backendagain, set it back to the real backend's values, Save.
There's only ever one apps_backend service — no separate service per backend/mock to flip between. We tried registering three services (real/Specmatic/Microcks) all routed to the same /api path, meant to be toggled by disabling the two not in use, but Kong's Route object has no enabled field (only Service does), and disabling a Service behind an already-matched Route doesn't fail over to another route — Kong's router just resolves one fixed winner among routes with an identical path and sticks with it regardless of that service's enabled state. So editing the one service in place, as above, is the reliable way to do this from the UI.
Whichever way you swapped away from the real backend, the most foolproof way back is make kong:reset — it deletes every route, service, and plugin Kong currently has live in its database and reloads straight from kong/conf/declarative.yml, so it doesn't matter what got changed (or fat-fingered) via the UI or Admin API in between; whatever's live gets fully discarded either way.
Sample scenario 3: measuring the payoff of async messaging — Kafka+Bridge and Locust's results, compared
Finally, let's replace writes to today's accounts table with async ingestion through Kafka, and actually measure what that does to a load test's results.
Why this pairs so well with event sourcing
First, some context: this backend's accounts table doesn't rewrite an account's balance in place — it appends one transaction at a time. That's event sourcing, and even in the cases where it's genuinely the better fit for the requirements — anywhere "what happened" is worth more as a record than "the current state" alone — I keep seeing it applied poorly.
With event sourcing, a write is always just a new row (an INSERT) — never an UPDATE to an existing one. There's no scenario where multiple requests fight over a lock on the same row, so the whole class of bugs that comes from lock contention and deadlocks mostly disappears. Each event also carries its own independent meaning; a later event never overwrites an earlier one's content, so you don't have to be precious about write ordering either.
The catch is that this only holds if you stick to it consistently: every write is an INSERT, full stop, and anything that looks like "current state" — a balance, say — is derived by aggregating those rows. The moment an UPDATE sneaks in anywhere, locking and ordering concerns creep back in right there, and event sourcing stops paying off.
That combination — "a write is just an append, and ordering doesn't matter" — is exactly what pairs well with async messaging like Kafka: it lets you go asynchronous without the implementation getting any more complicated.
Introducing Kafka+Bridge
make apps:up
make kafka:up
make kafka:bridge-up
kafka:bridge-up starts a small standalone consumer (kafka/bridge/) that reads events off the Kafka topic and forwards each one to the REST backend as a POST /accounts call. It targets apps/backend by default, but KAFKA_BRIDGE_TARGET_URL can point anywhere, same as every other test tool's target host. It's deliberately its own make target, opted into separately from kafka:up, and it runs in its own container rather than inside apps/backend — so a Kafka or backend outage only ever affects the bridge itself. In fact, it just retries forever on a failed delivery and only commits a Kafka offset after a successful one, so an outage pauses ingestion rather than losing events. The backend itself has zero knowledge that Kafka exists — if Kafka, or kafka-bridge itself, goes down, the backend is completely unaffected.
REST's synchronous path vs. Kafka's asynchronous path — where the errors show up
Handling requests synchronously and directly over REST is simple and easy to reason about, but it can bite you if you're not careful. When more requests than expected land at once, that's exactly when errors tend to show up — and recovering from them (retries, sorting out partial failures, notifying whoever's waiting) falls entirely on the caller. If that scenario — a burst of requests causing errors that are then painful to recover from — is something you're worried about, putting a messaging layer like Kafka in front of the write path has a real benefit: it decouples the caller's success from the backend's momentary processing capacity.
To actually put numbers to that benefit, we ran a comparison test using NASEBANAL Quickstarts.
A quick word on Locust — User count vs. RPS, and scaling out
Before getting into the comparison itself, it's worth a quick detour into how Locust, the tool we used to generate load, actually works.
Locust sets the intensity of a load test by "User count" — the number of virtual users running at once. Each user acts as one virtual client, repeatedly running whatever task you defined (here, firing POST /accounts). Set wait_time to zero, as we did, and it never waits between requests either.
What comes out the other end is RPS (requests per second). And this is the key point: RPS isn't a parameter you set directly in Locust — it's an output. Bump the User count all you want; if the target server can't keep up, RPS plateaus or even drops, and all you get is longer latency and more failures.
So when you look at a Locust result and RPS isn't climbing, or is low, you need to work out which of two things is actually going on:
- The load-generation side (Locust) doesn't have enough Users — one process can only generate so many concurrent requests, so simply adding more load would push RPS higher
- The target server's own throughput has plateaued — if RPS won't climb (or the failure rate climbs instead) no matter how many Users you add, the bottleneck is on the server side
The direct-REST path (Path A) below is a textbook case of #2. Even with 600 users thrown at it, the backend's connection pool became the bottleneck, and only 58 requests actually got through in 60 seconds — barely 1 RPS. Adding more Users at that point wouldn't raise RPS at all; it would just make the failure rate worse.
Conversely, if you want to check — or increase — whether Locust's own load-generation capacity is the limiting factor, that's what scaling out is for. Locally, LOCUST_WORKERS adds more worker containers; if one machine still isn't enough, make locust:join-cluster lets another machine join the cluster as a worker. The master assigns Users to each worker, each worker fires requests at the target server, and response times and pass/fail results all flow back to the master for aggregation.
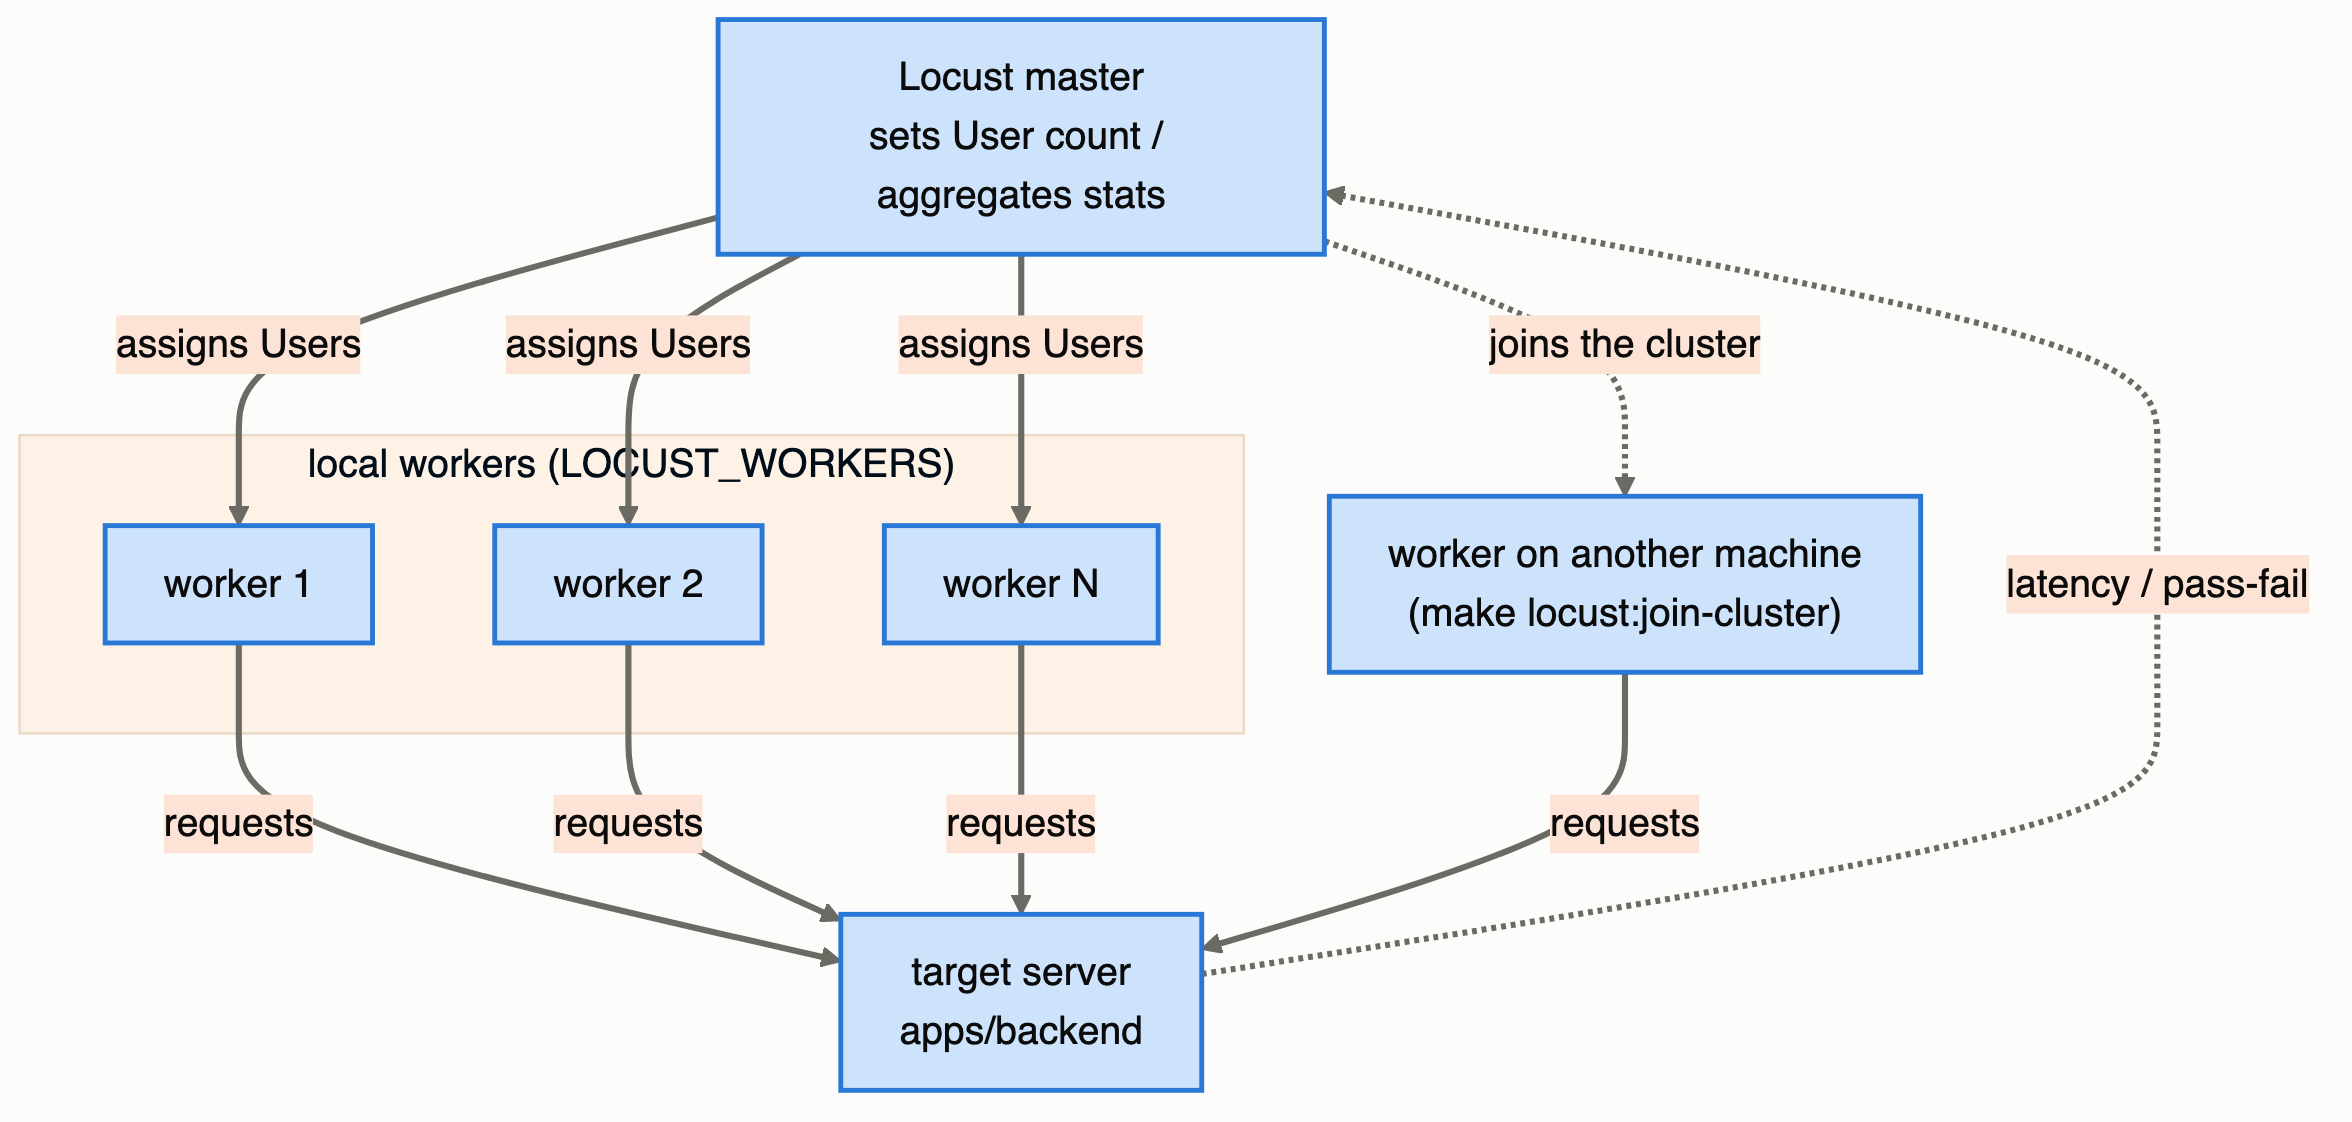
This experiment itself stayed on a single laptop with a single worker — the target server was the one deliberately left under-tuned, since the point was to find its limits, not Locust's. If you're after a higher-RPS load test, this scale-out path is where to look — and NASEBANAL Quickstarts makes setting up a Locust cluster for it possible, too.
Designing the experiment — the same write, two paths in
What we compared was two paths that both drive continuous writes into apps/backend:
- Path A (synchronous, direct REST): virtual users from Locust hammer
POST /accountsdirectly (locustfile_http_overload.py). - Path B (asynchronous, via Kafka): the same events are simply produced onto a Kafka topic (
locustfile_kafka.py). On the backend side, thekafka-bridgewe started above reads the topic at its own pace and forwards each event as aPOST /accountscall.
Both paths run with zero think time (virtual users never wait between requests), 600 users, a spawn rate of 200 users/second, for 60 seconds straight — less a realistic traffic pattern than a deliberately reproduced burst-overload scenario. The backend runs in Docker on a single laptop, with uvicorn left as a single worker in --reload mode and SQLAlchemy's default connection pool (pool_size=5 + max_overflow=10) — an intentionally under-tuned setup for both runs.
Reproducing it
make apps:up
make kafka:up
make kafka:bridge-up

# Path A: direct REST
make locust:test LOCUST_FILE=locustfile_http_overload.py \
  LOCUST_USERS=600 LOCUST_SPAWN_RATE=200 LOCUST_RUN_TIME=60s

# Path B: via Kafka, same load pattern
make locust:test LOCUST_FILE=locustfile_kafka.py \
  LOCUST_USERS=600 LOCUST_SPAWN_RATE=200 LOCUST_RUN_TIME=60s
Both runs happened back to back, under 2 minutes apart, on the same environment with the same load pattern, so there's little room for timing-related variance between them.
Results
Path A (direct REST): over 60 seconds, only 58 POST /accounts requests got through, and 46 of them failed — a 79% failure rate. The breakdown: 38 "500 Internal Server Error", 7 "ConnectionResetError", and 1 "RemoteDisconnected (remote end closed connection without response)". Most failed requests hung for close to Locust's 30-second timeout ceiling; average response time for /accounts alone ballooned to 23,477 ms (roughly 23 seconds). Under overload, nearly every virtual user got blocked, which is also why so few requests got through in 60 seconds in the first place.
Path B (via Kafka): over the same 60 seconds, 1,241,297 events were produced onto Kafka, with zero failures (0%). Median latency was 23 ms, average 24.3 ms, and throughput ran at roughly 20,673 events/second — more than two orders of magnitude faster than the direct-REST path. The backend's own /health endpoint held steady at around 2 ms the entire time.
Plotting Locust's own per-second cumulative request counts makes the gap obvious at a glance (log-scale y-axis: direct REST plateaus almost immediately, while the Kafka path keeps climbing at a near-constant rate for the full 60 seconds).
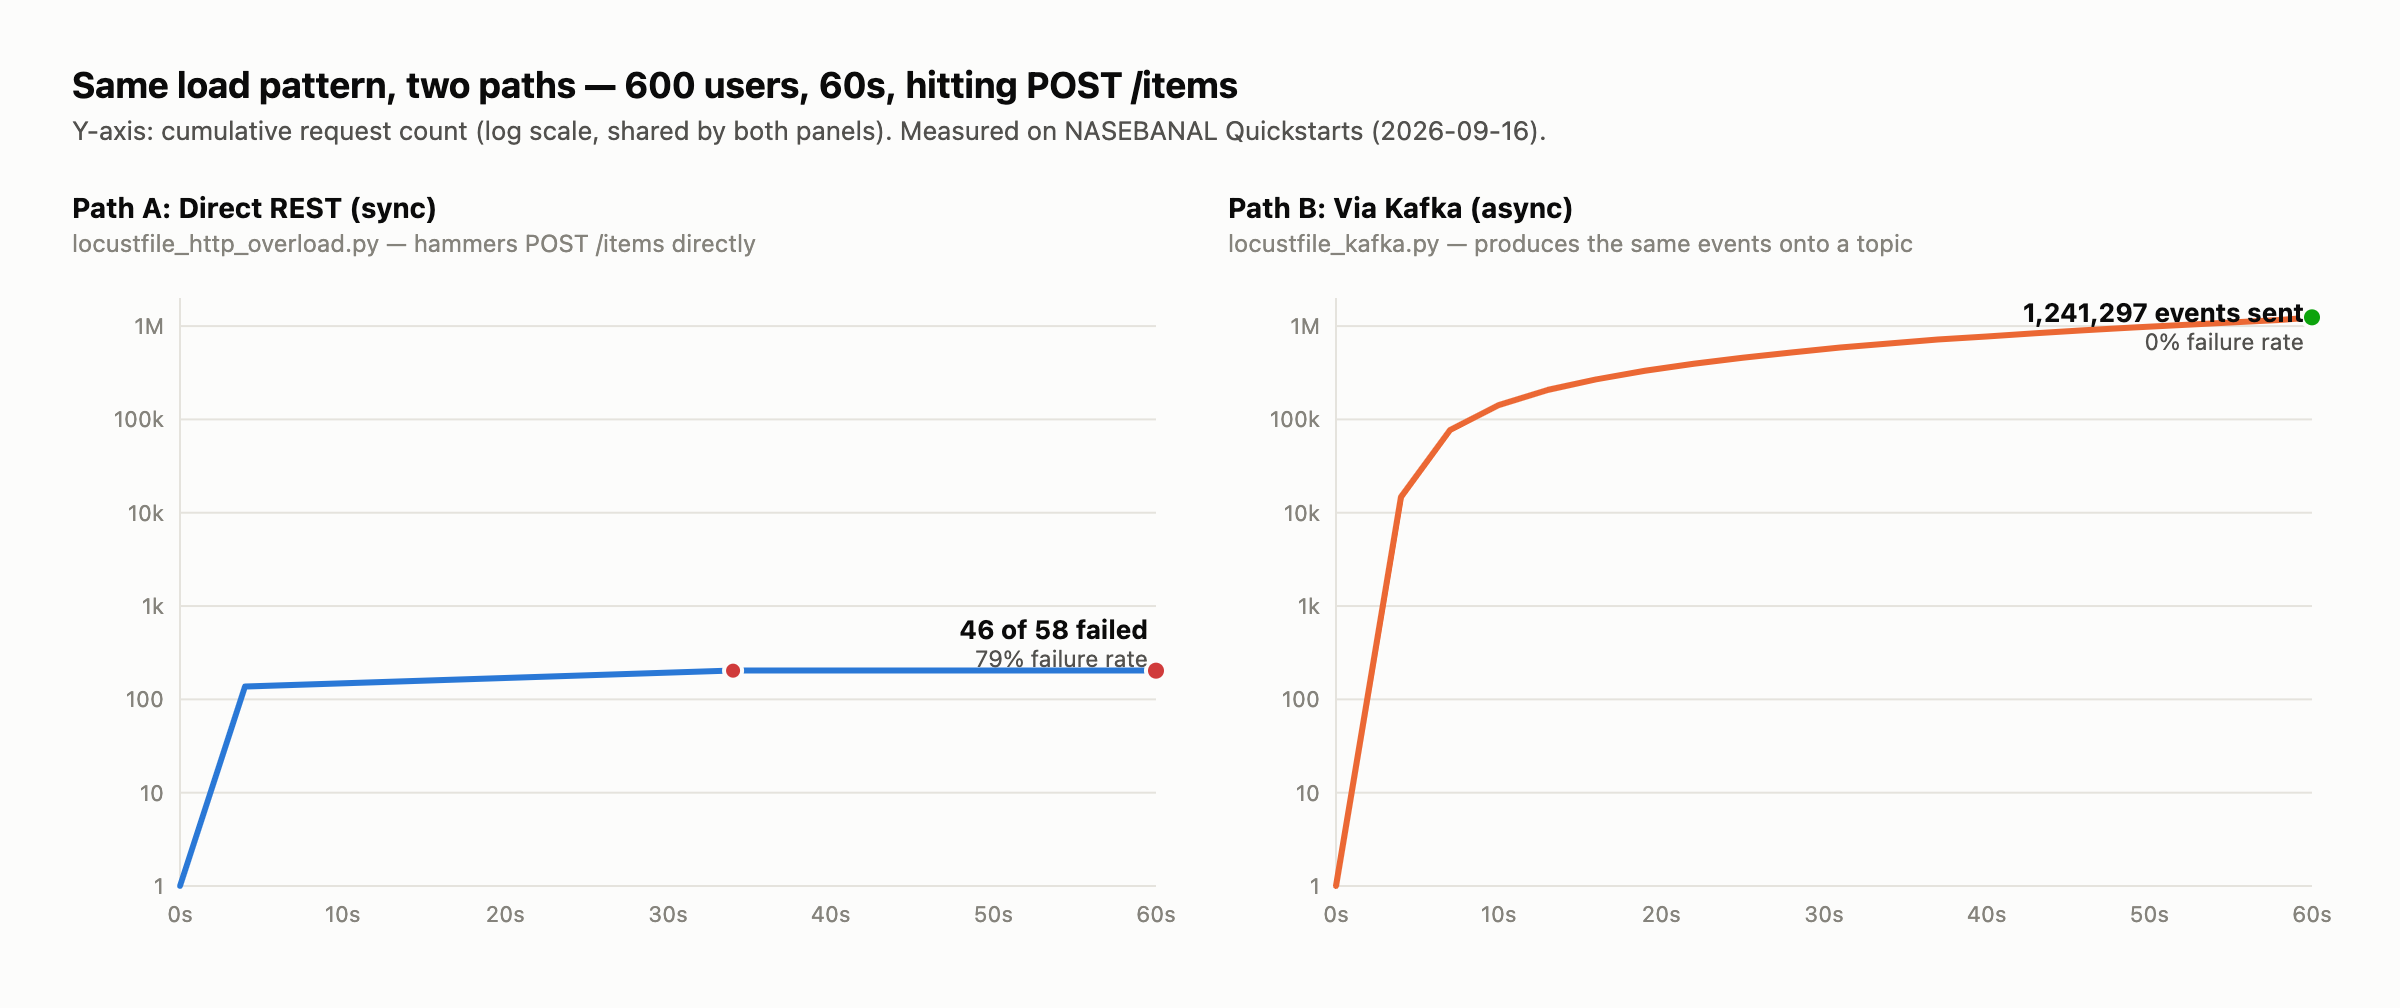
- Direct REST: 46 of 58 failed (79% failure), latency degraded to multi-second territory
- Via Kafka: 0 of 1,241,297 failed (0% failure), latency stayed steady in the low milliseconds throughout
Why the gap
On the direct-REST path, the caller's success or failure is directly tied to how much capacity the backend happens to have at that instant. Since this backend is deliberately left with a single worker and a tiny connection pool, 600 users' worth of simultaneous requests exhaust the pool, connections back up, and timeouts and 500 errors follow. The caller has no way to know how loaded the backend currently is and just keeps firing — so load converts directly into an error rate.
On the Kafka path, all the caller (each Locust virtual user) is doing is "append to Kafka's log." That's bounded only by the broker's own write throughput, entirely independent of the backend's processing capacity. kafka-bridge reads the topic at its own pace, converting and forwarding events to POST /accounts one at a time — so from the backend's point of view, the load has been smoothed from "a burst" into "an ordinary, steady trickle of requests." In other words, Kafka doesn't eliminate the load itself — it absorbs the burst and changes the shape in which it reaches the backend.
This isn't a claim that async messaging is a silver bullet. Putting Kafka in front of a write path adds operational cost and architectural complexity, and raises the usual eventual-consistency question — data isn't "in" until kafka-bridge has actually forwarded it. But actually measuring it made one thing concrete: decoupling the write-path's receiving end from its processing capacity fundamentally changes how a burst of load gets absorbed.
Wrapping up
Running three sample scenarios with NASEBANAL Quickstarts, three things came out of it:
- Test execution: unit (pytest / vitest), contract (Specmatic, both Provider and Consumer directions), E2E (Playwright), and load (Locust) tests all run the same way — a single
make <module>:test— and each leaves an HTML report behind. When test strategies and tooling tend to be all over the place project to project, having one consistent interface for running tests and reading the results is worth something on its own - Integration through Kong: rewriting a single connection target,
apps_backend, is enough to swap between the real backend, Specmatic's stub, and Microcks' mock — with zero changes to the frontend or test code. The same swap works whether you editdeclarative.ymlby hand or through Kong Manager, andmake kong:resetis always a reliable way back - Measuring the payoff of async messaging: the direct-REST path failed 46 of 58 writes under 600 users of load (79% failure). Routing the same load through Kafka+Bridge instead absorbed 1,241,297 events with zero failures. Kafka doesn't eliminate the load itself — it absorbs the burst and changes the shape in which it reaches the backend
This isn't a claim that async messaging is a silver bullet — there are real trade-offs in operational cost and eventual consistency. But if you can already see a scenario where a burst of requests would cause errors that are then painful to recover from, this experiment backs up, with actual numbers, that Kafka-style messaging is worth considering.
All three scenarios are reproducible on your own machine — they're written up as-is in the NASEBANAL Quickstarts README. Give make apps:up a spin if you're curious.