We built NASEBANAL Quickstarts for use in training as part of NASEBANAL's consulting services, and publish it as open source. This post covers why we built it, how it fits together, and its seven scenarios, along with the key features of the OSS tools they use, the processing flow, and what we actually got when we ran them. The step-by-step instructions live in the demo app's built-in docs and the repository README, so here we stick to *what you can try, and what we were able to confirm*.
Why we built NASEBANAL Quickstarts
AI coding agents are spreading fast, and handing off implementation work by describing requirements to them is becoming routine. But hand an AI too large a requirement at once, and it stumbles the same way a person does — details get missed, scope gets muddled. Breaking requirements into smaller, clearly-bounded pieces is, I think, part of why architectures like microservices are getting a fresh look.
At the same time, microservices bring in concepts a monolith never made you think about: an API gateway, event streaming, service discovery, contract testing, API mocking, an identity provider, secret management, observability. Adopting the right tool for each matters. But the more tools you add, the more each one's install steps, start/stop commands, and admin-console access diverge — and that's not something anyone can keep memorized.
I've also noticed that software quality and architecture practices vary wildly by vendor, and even project to project — often boiled down to whatever one person happens to know. Standardizing the test strategy, the tooling, and how test results get managed is what actually raises the floor on software quality overall. To absorb that "every tool does it differently" problem, we built NASEBANAL Quickstarts (repository name: nb-quickstarts), an open-source tool NASEBANAL publishes.
NASEBANAL Quickstarts' structure and features
Every module is driven by the same Docker Compose call — make <module>:up / make <module>:down — and any tool with an admin console opens it straight from make <module>:open. Once you're done, make <module>:down cleans up after itself, so there's no leftover cruft to worry about. Each technology in the NASEBANAL Stack is carved out as its own module.
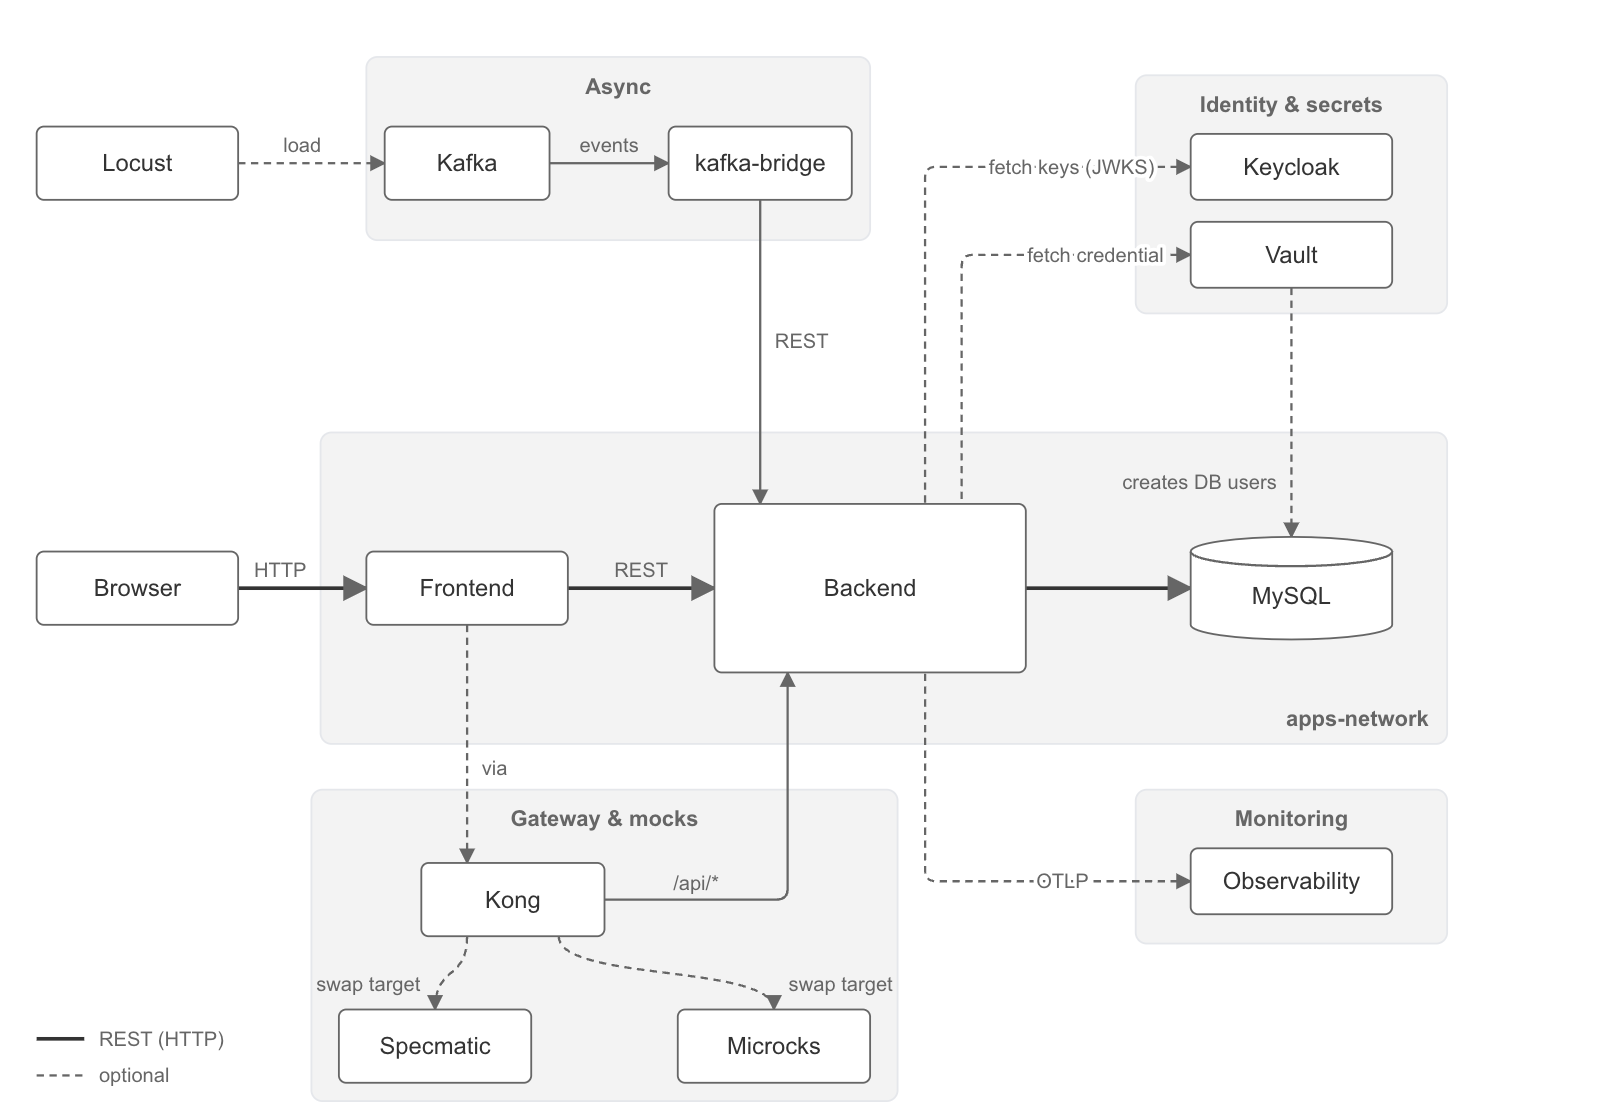
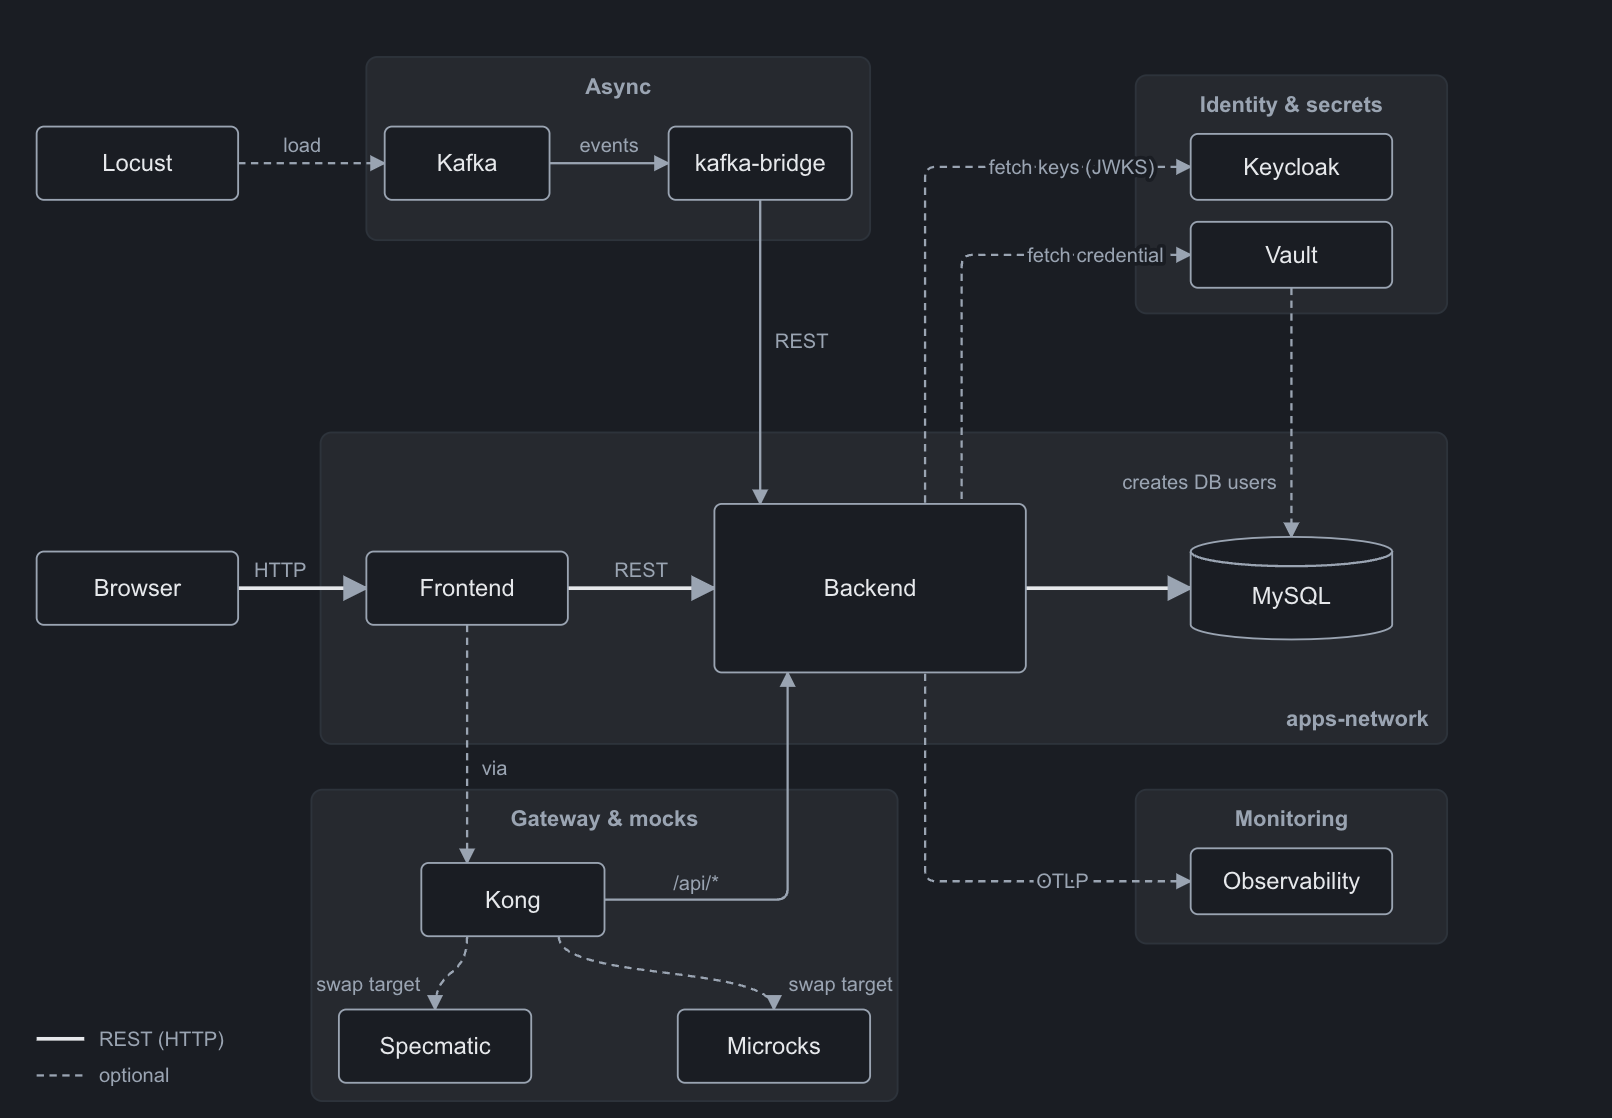
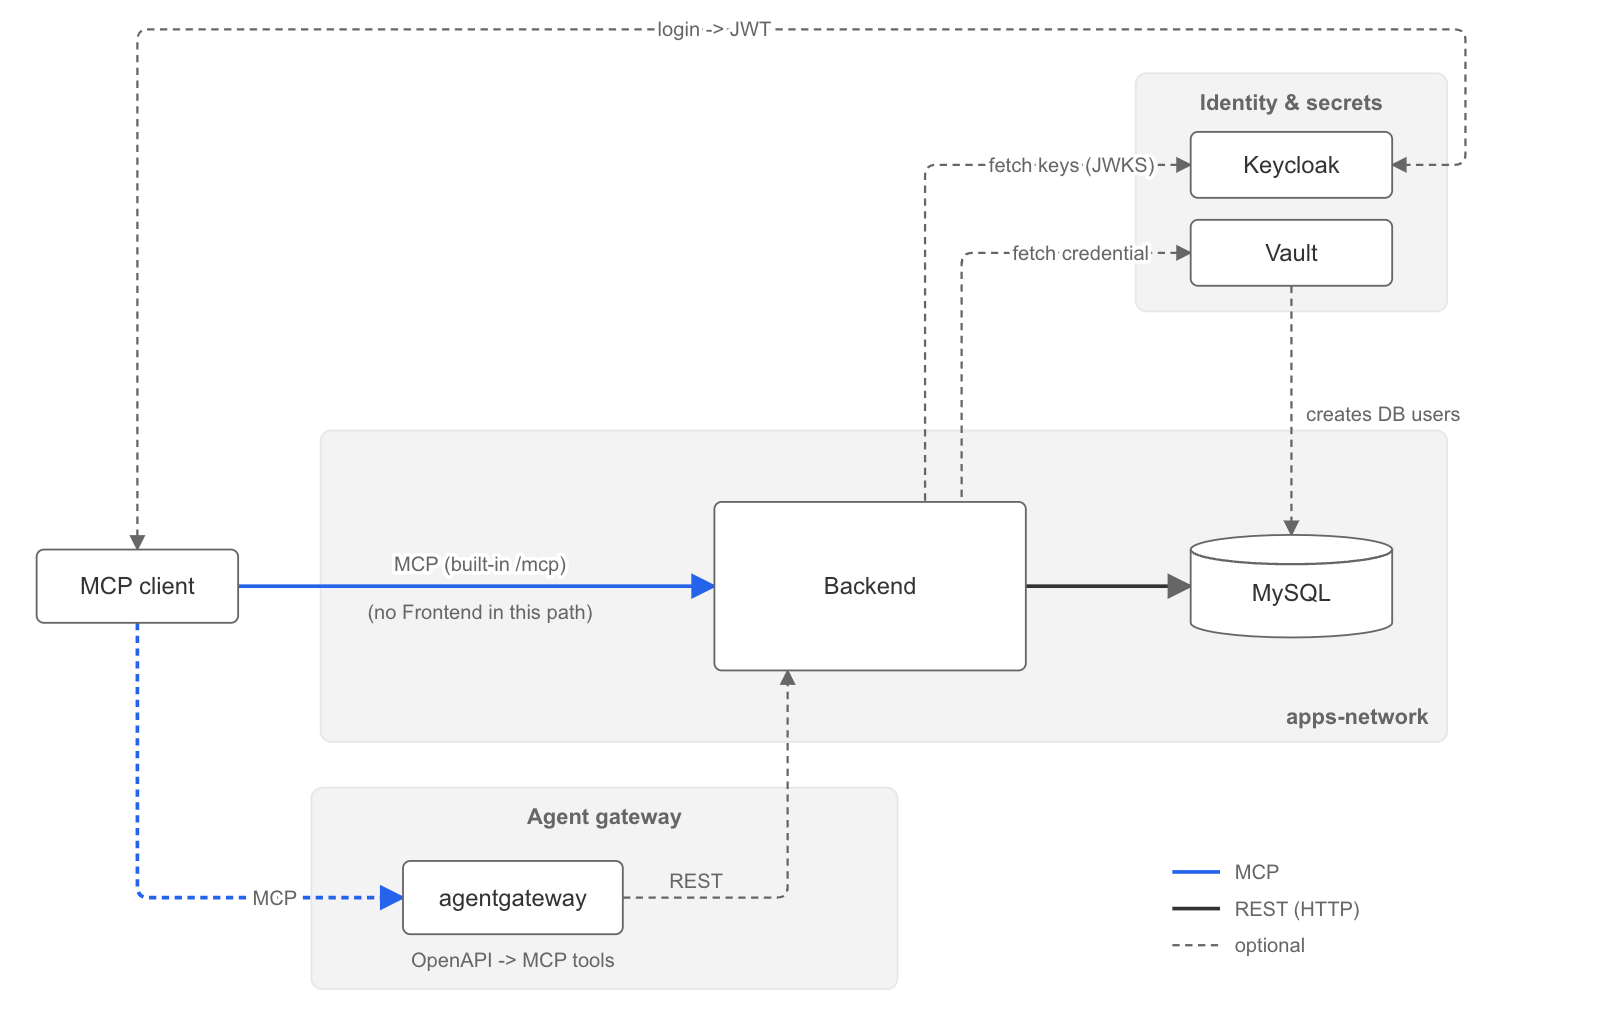
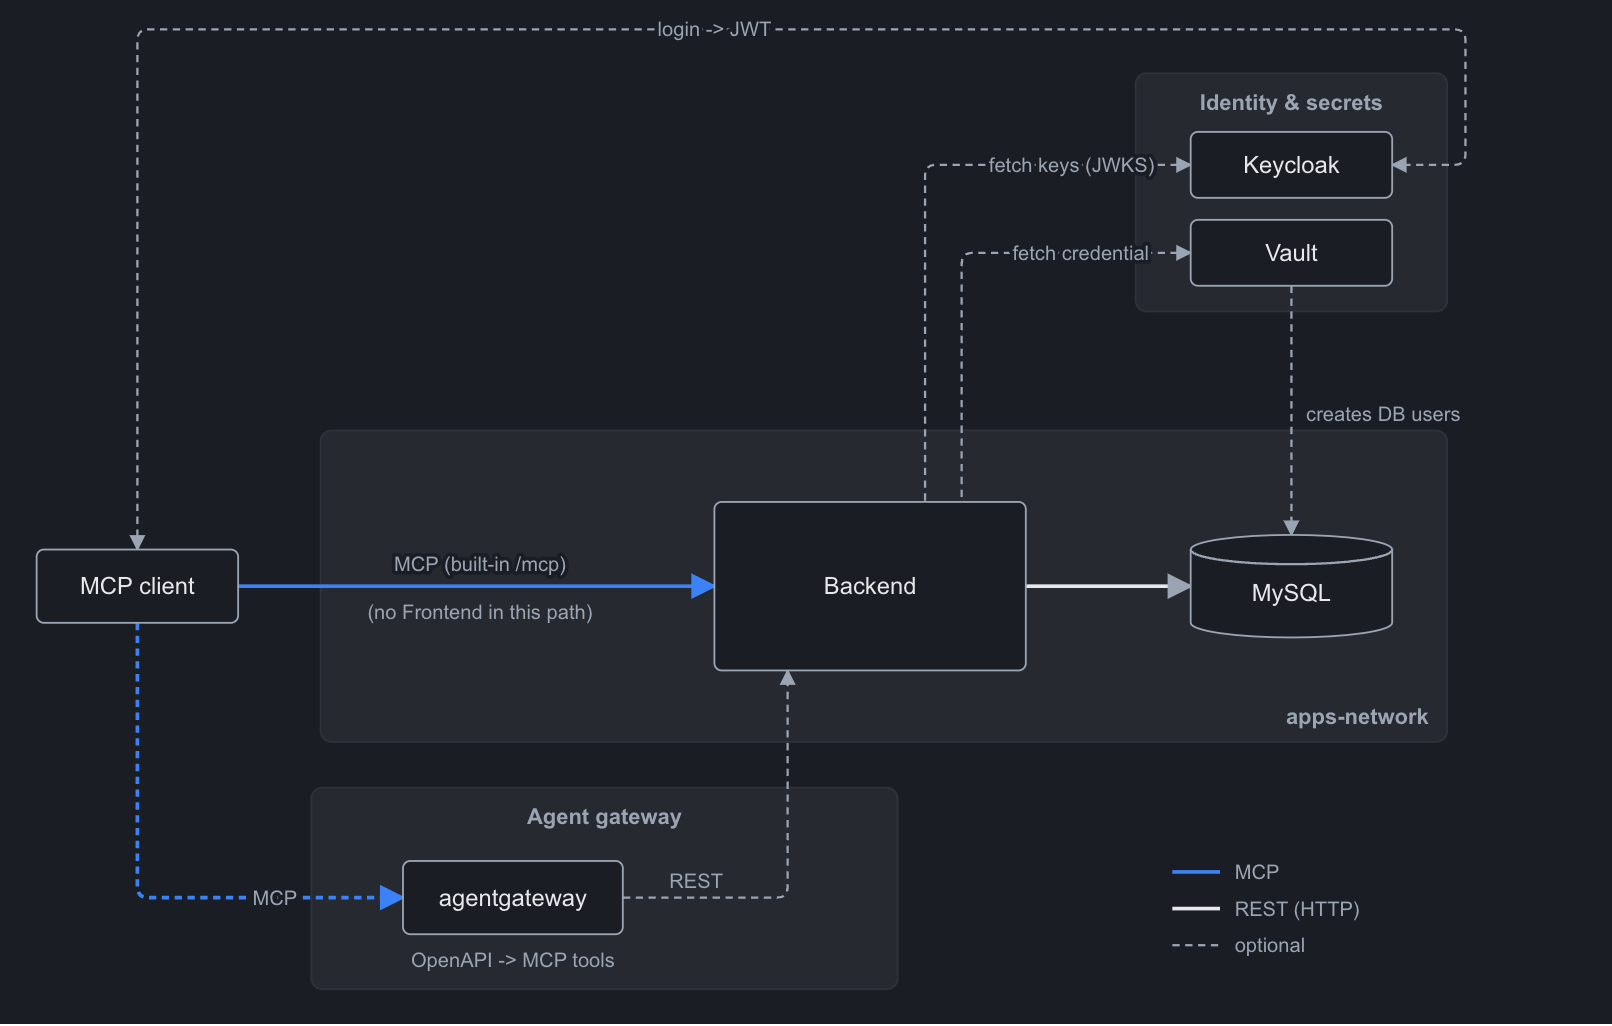
The overall picture comes in the two diagrams on the Overview page of the demo app's built-in docs.
The big picture — apps-network and the modules around it
The first is the overall diagram. Centered on the test-target apps (frontend, backend, MySQL), Kong in front of it, Kafka for async ingestion, Keycloak for identity, Vault for secrets, and Observability for monitoring all sit on the same network (apps-network), and you can combine just the ones you need. Arrows point from the caller to what it calls, and dashed lines are integrations that are off by default.
The MCP access path — built-in /mcp and agentgateway
The second diagram shows how an MCP client, such as an AI agent, reaches the backend (the parts involved in Scenarios 5 to 7). The MCP client skips the Frontend and goes through the backend's built-in /mcp, or optionally through agentgateway (dashed, like Kong), which builds MCP tools from the OpenAPI contract and calls the REST API. The JWT from the Keycloak login is verified at the backend, and the backend gets its DB credential from Vault.
The demo app, and its built-in docs
The test-target apps module is a simple accounting-ledger app: a FastAPI backend serving REST, GraphQL and MCP, and a Next.js frontend. The data follows an event-sourcing approach — an account's balance is derived as the sum of the transactions appended one by one. Tools like Playwright and Locust are ready to try against it right away.
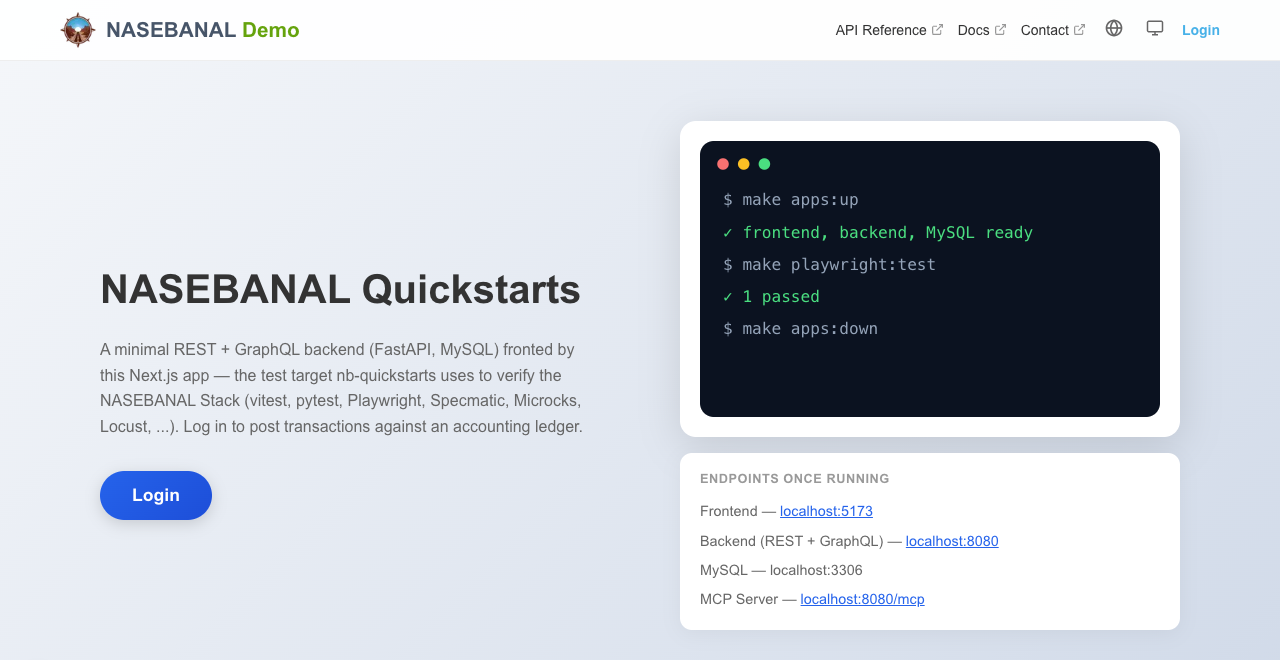
Start it with make apps:up and the demo app ships with its own docs (/docs). You can read each scenario's steps right next to the running app, with the commands and what "working" should look like.
The scenarios
There are seven scenarios, numbered the same way as in the in-app docs. Scenario 1 verifies the demo app itself with the test tools; Scenarios 2 to 7 each take one module from the diagrams above and wire it into the same running apps to see how it behaves. Below, each scenario comes with what it does, the key features of the OSS tools it uses, and what we actually confirmed.
Scenario 1: Verify the demo app
Verify the operation of the demo app itself, the same running apps that every other scenario builds on, with the test tools that ship in the box. Each tool has its own make command and leaves an HTML report behind; the report screens are shown in "Test result reports" below.
- pytest and Vitest — unit tests, run without a browser. pytest swaps MySQL for an in-memory database, so the backend tests need no other service; Vitest covers the frontend's logic (the API client, the OIDC PKCE flow and the backend resolver)
- Playwright — end-to-end tests that drive the real frontend in a browser against the real backend and MySQL
- Specmatic — contract tests: it reads the hand-written
openapi.yaml, sends requests to the running backend and reports coverage per path, method and response code, including the error responses - Microcks — a second provider check: it sends the examples written in
openapi.yamlto the real backend and checks each response against the example and the schema - Locust and OWASP ZAP — load tests and security scans
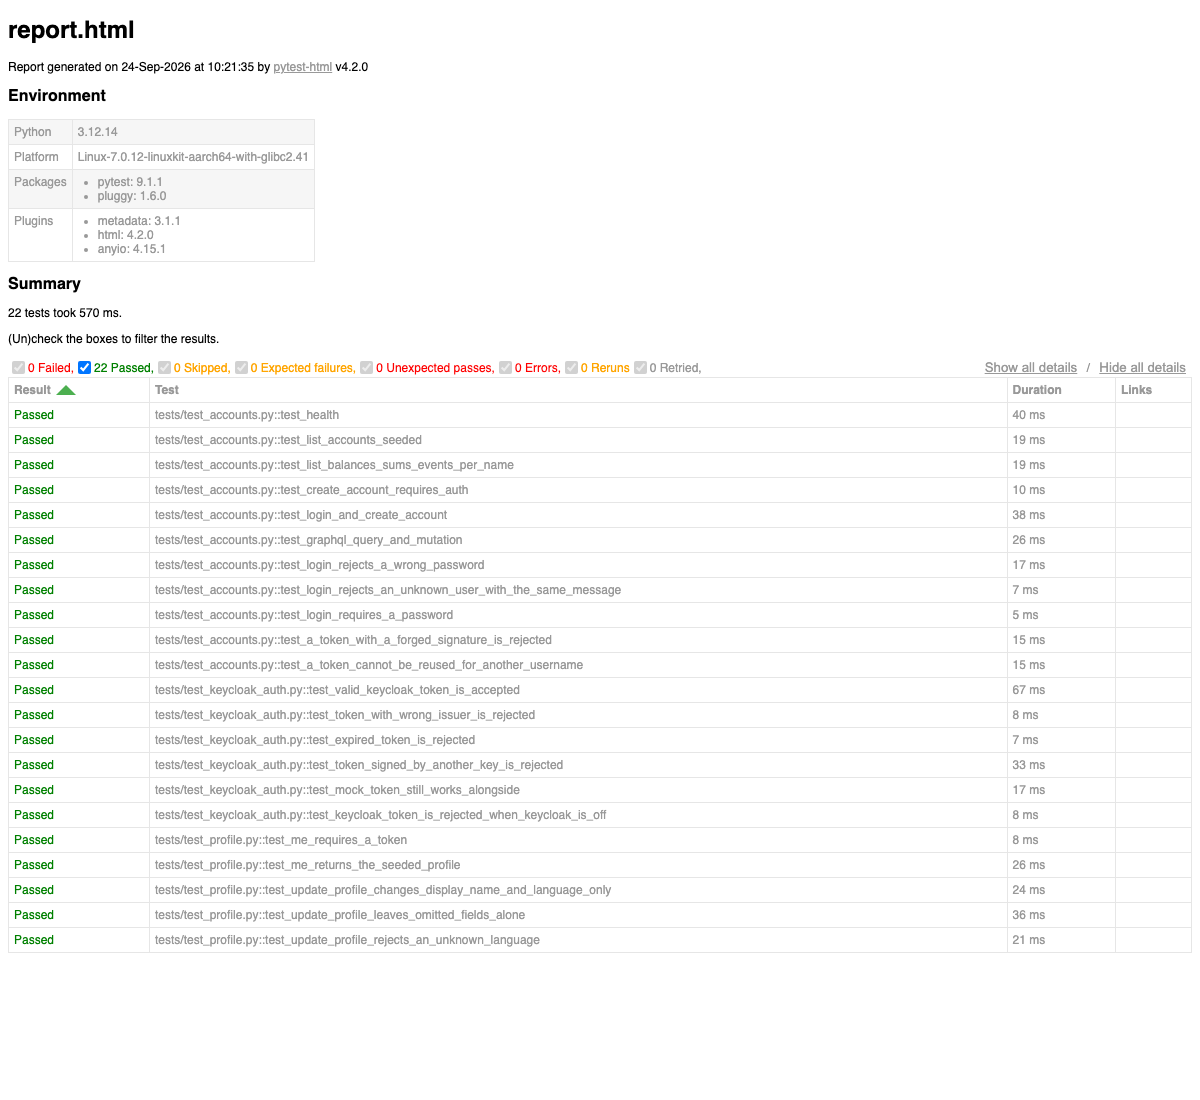
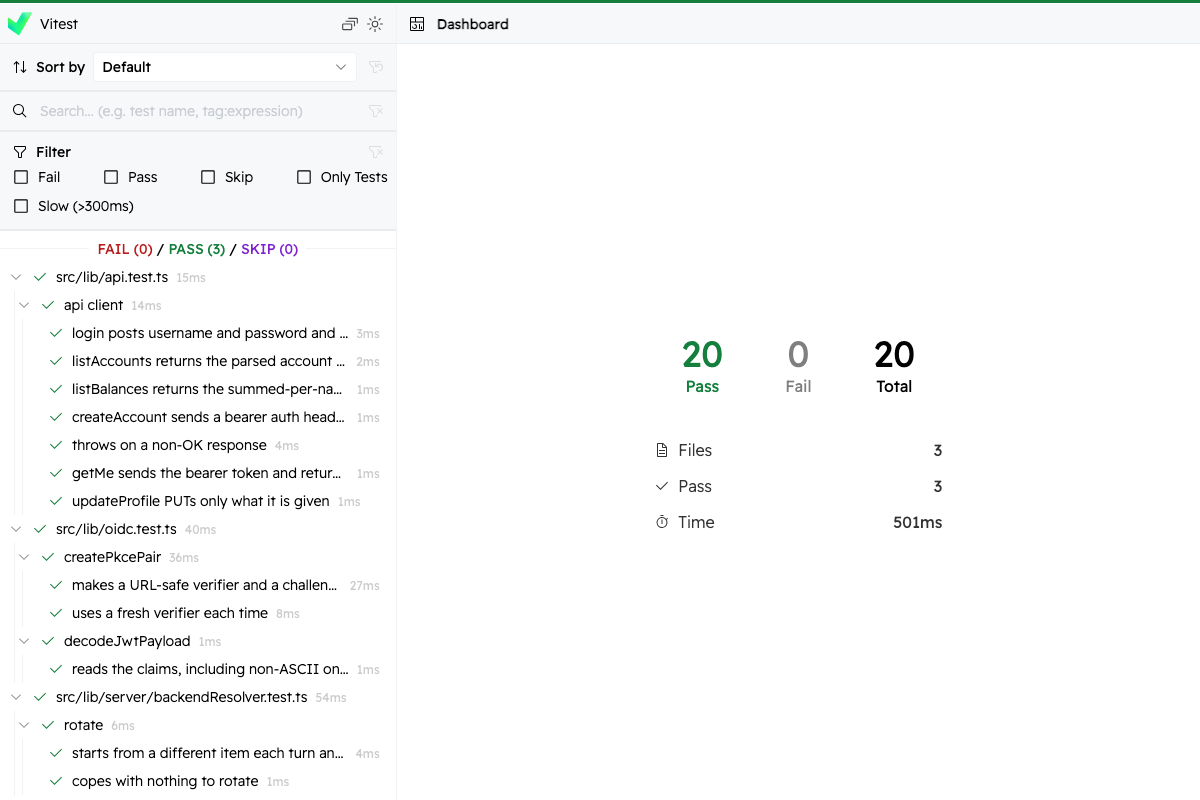
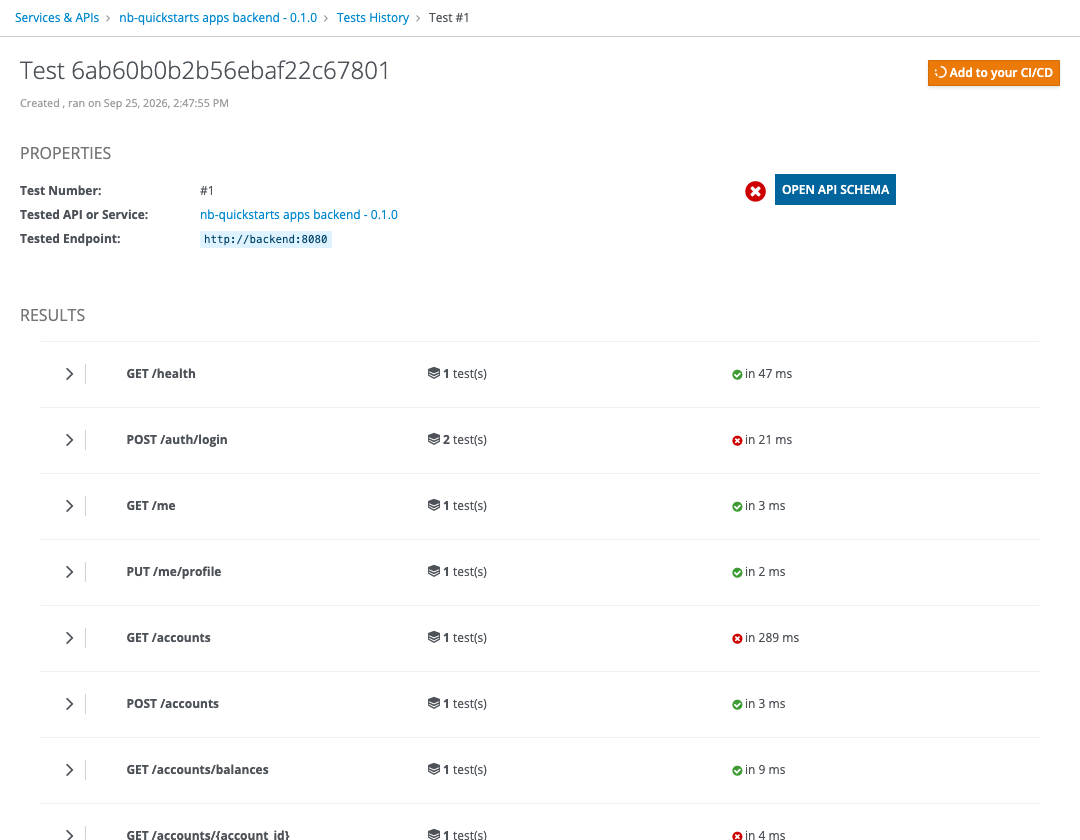
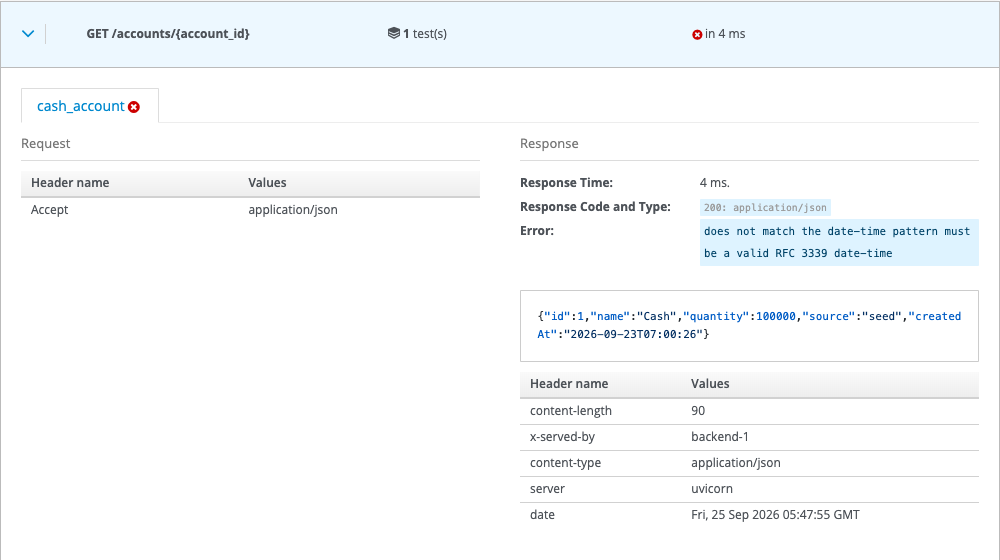
What we confirmed: the 22 pytest tests, 20 Vitest tests, 9 Playwright tests and all 18 Specmatic scenarios (100% API coverage) passed. Microcks was the one that found something. Of the 9 examples it ran, 6 passed and 3 failed, and the failures were findings rather than test defects. First, createdAt is declared as format: date-time in the contract, but the backend answers 2026-09-23T07:00:26 with no time zone offset, which is not valid RFC 3339. Specmatic passes all 18 scenarios against the same backend, whereas Microcks flags the format: a genuine gap between the contract and the implementation. Second, POST /auth/login has a response example named bad_credentials but no request example with that key, so Microcks sends an empty body and gets a 422 instead of the 401 the example expects. That one is a gap in the examples, not a backend defect.
Scenario 2: Switch to Kong
Route the frontend through the Kong API gateway, then repoint the Gateway Service apps_backend from the real backend to Specmatic's stub or Microcks' mock. The frontend code doesn't change at all, yet it's now talking to a mock built from the same contract.
- Kong — puts authentication, rate limiting and routing in one gateway in front of the backend, and lets you change where traffic goes at runtime without touching application code. In Kong Manager, the admin UI, editing a service's Host / Port / Path and saving is all it takes to switch. This scenario runs Kong in DB mode, keeping its configuration in PostgreSQL
- Specmatic — generates a mock server (a stub) straight from the OpenAPI contract. The same contract can verify the real backend too, so the mock and the implementation can't quietly drift apart
- Microcks — import the contract once and get a running mock with example responses, so consumers such as the frontend can develop before the real API is ready
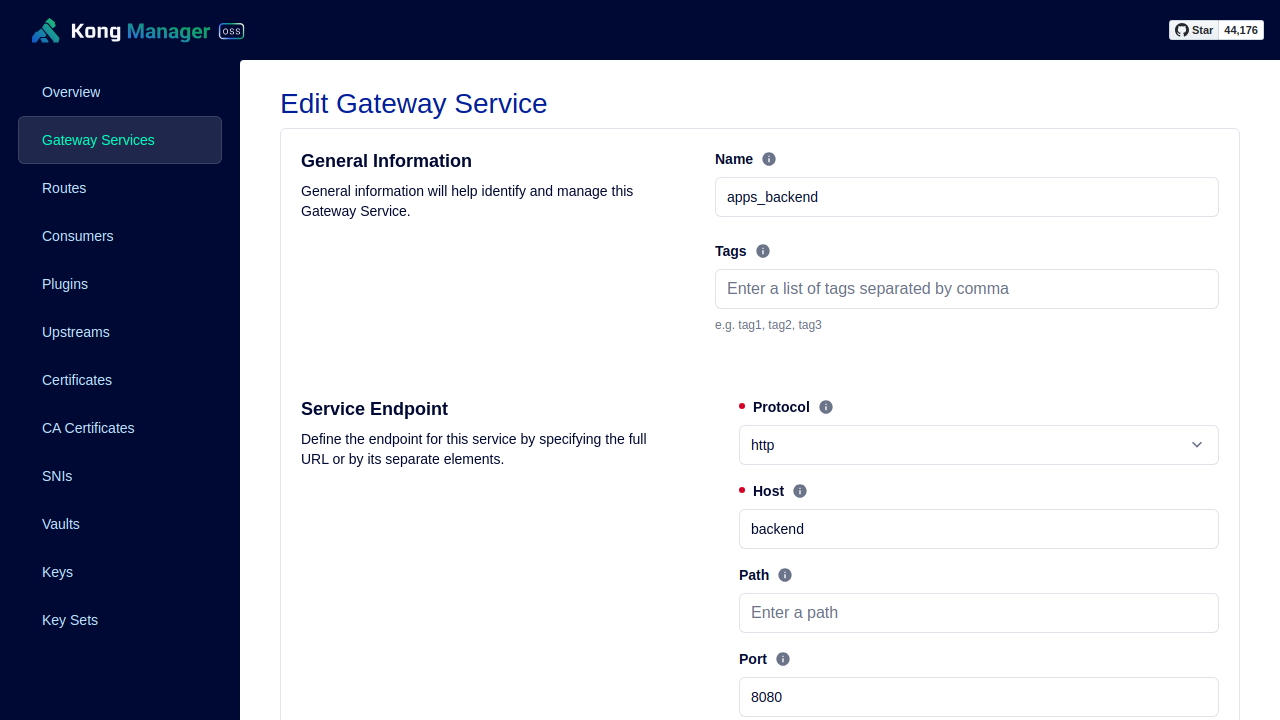
What we confirmed: we ran the exact same curl http://localhost:8000/api/accounts/balances before and after the switch. Before it, the real ledger data came back (for example, Cash at a balance of 120,000). After repointing Kong at Specmatic's stub, the same URL returned a different value that matches the schema but is randomly generated. That difference shows the target was swapped through a runtime configuration change alone, with no frontend edit. One limit: Microcks can't mock POST /accounts, because an OpenAPI example has no way to carry the real bearer token it needs (read endpoints work fine).
Scenario 3: Switch to Kafka
Buffer writes in Kafka and have kafka-bridge (a small consumer that reads the Kafka topic and sends each event to the backend as a POST /accounts) forward them one at a time, then compare the same load hitting REST directly versus going through Kafka.
- Kafka — producers write to a durable log at their own pace while the consumer drains it at a steady rate. It absorbs bursts, and because messages are retained until consumed, a backend outage only delays processing instead of dropping data. Producers and consumers don't need to know about each other, so either side can be added, scaled or replaced independently
- Locust — load scenarios are written in Python and run from the web UI or from the command line, as in
make locust:test. It also supports distributed runs, where a Locust master assigns users to several workers, and leaves an HTML report behind
What surprised us: we sent the same write (POST /accounts) for 60 seconds with 600 users and zero think time. The backend ran on a single laptop, deliberately left in a weak, untuned configuration.
- Direct REST: 46 of 58 writes failed (79%). The connection pool was exhausted under the overload, and responses degraded to seconds
- Via Kafka: it absorbed 1,241,297 events with zero failures, with responses steady in the millisecond range throughout
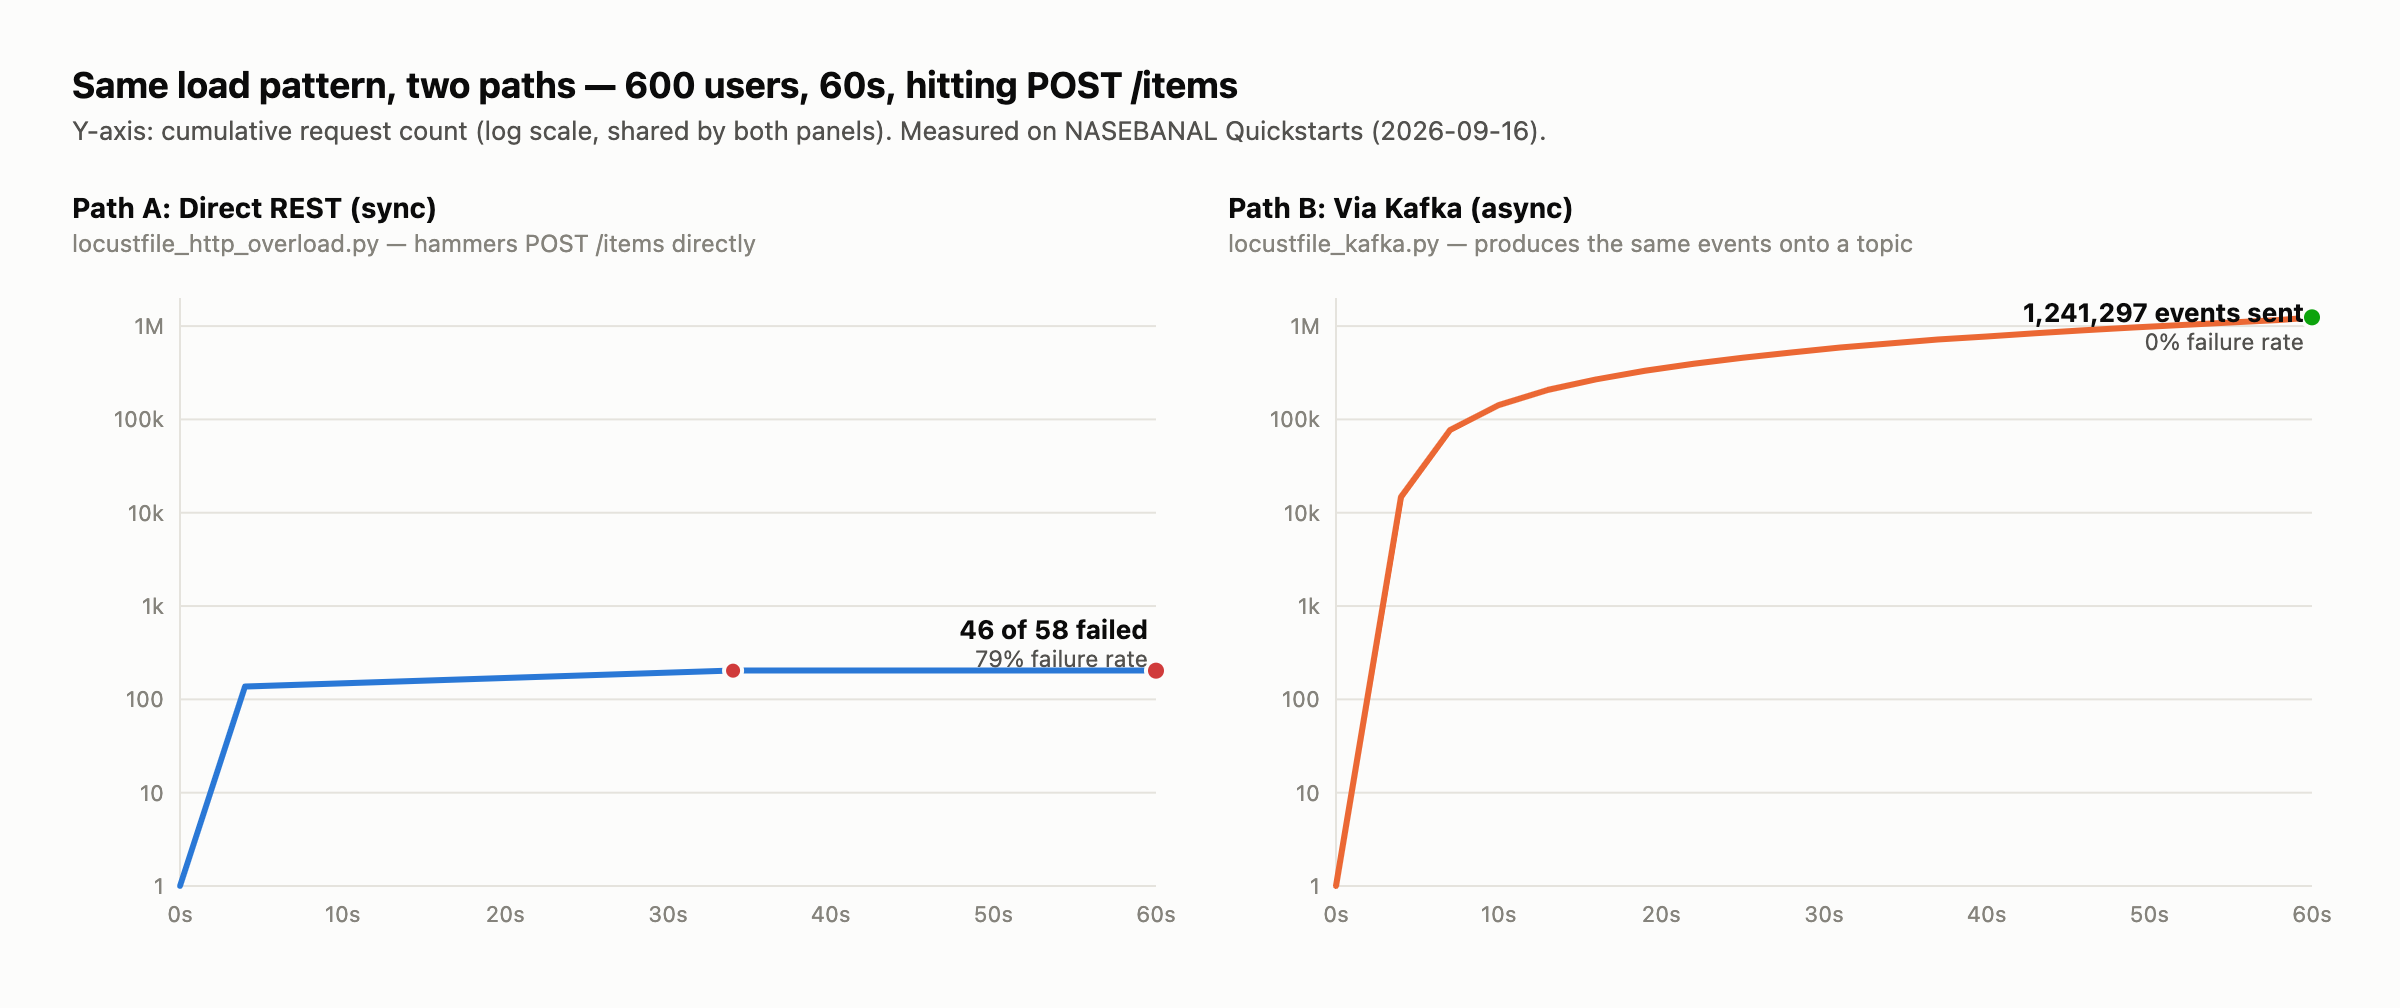
That said, Kafka didn't make the load disappear. kafka-bridge forwards to the backend at its own pace, so what's really happening is that the burst gets absorbed and the shape in which it reaches the backend changes. In fact, looking at the consumer group after a 300-user, 40-second run, about 920,000 of the roughly 1.66 million events written had not reached the backend yet (the lag). "Written to Kafka" and "applied by the backend" are different things, and the latter takes time. Trade-offs like that eventual consistency and the added operational cost are real — but separating the write intake from the processing capacity changes how a sudden burst is handled entirely, and we were able to confirm that with actual numbers.
Scenario 4: Observability
Send the backend's traces, metrics and logs over OpenTelemetry and view them in Prometheus, Tempo, Loki and Grafana. Watch a load run live in Grafana, all the way to an alert firing through Alertmanager.
- OpenTelemetry — a vendor-neutral standard for traces and metrics. Instrument once, and you can switch the receiving side (a local stack here, New Relic in production, for example) without touching app code. In this scenario, FastAPI requests and SQLAlchemy queries, HTTP server metrics and application logs are all sent to a Collector over OTLP
- Prometheus / Tempo / Loki — purpose-built stores for metrics, traces and logs, all open source with no license cost. Prometheus also evaluates the alert rules
- Grafana — metrics, traces and logs in one place. A log line carries its
trace_id, so you can jump from a log to its trace, and from a trace to that span's logs, without copying an ID by hand - Alertmanager — turns Prometheus alerts into notifications by grouping, de-duplicating and routing them. It can also mute minor alerts for the same service while a more severe one is firing (inhibition)
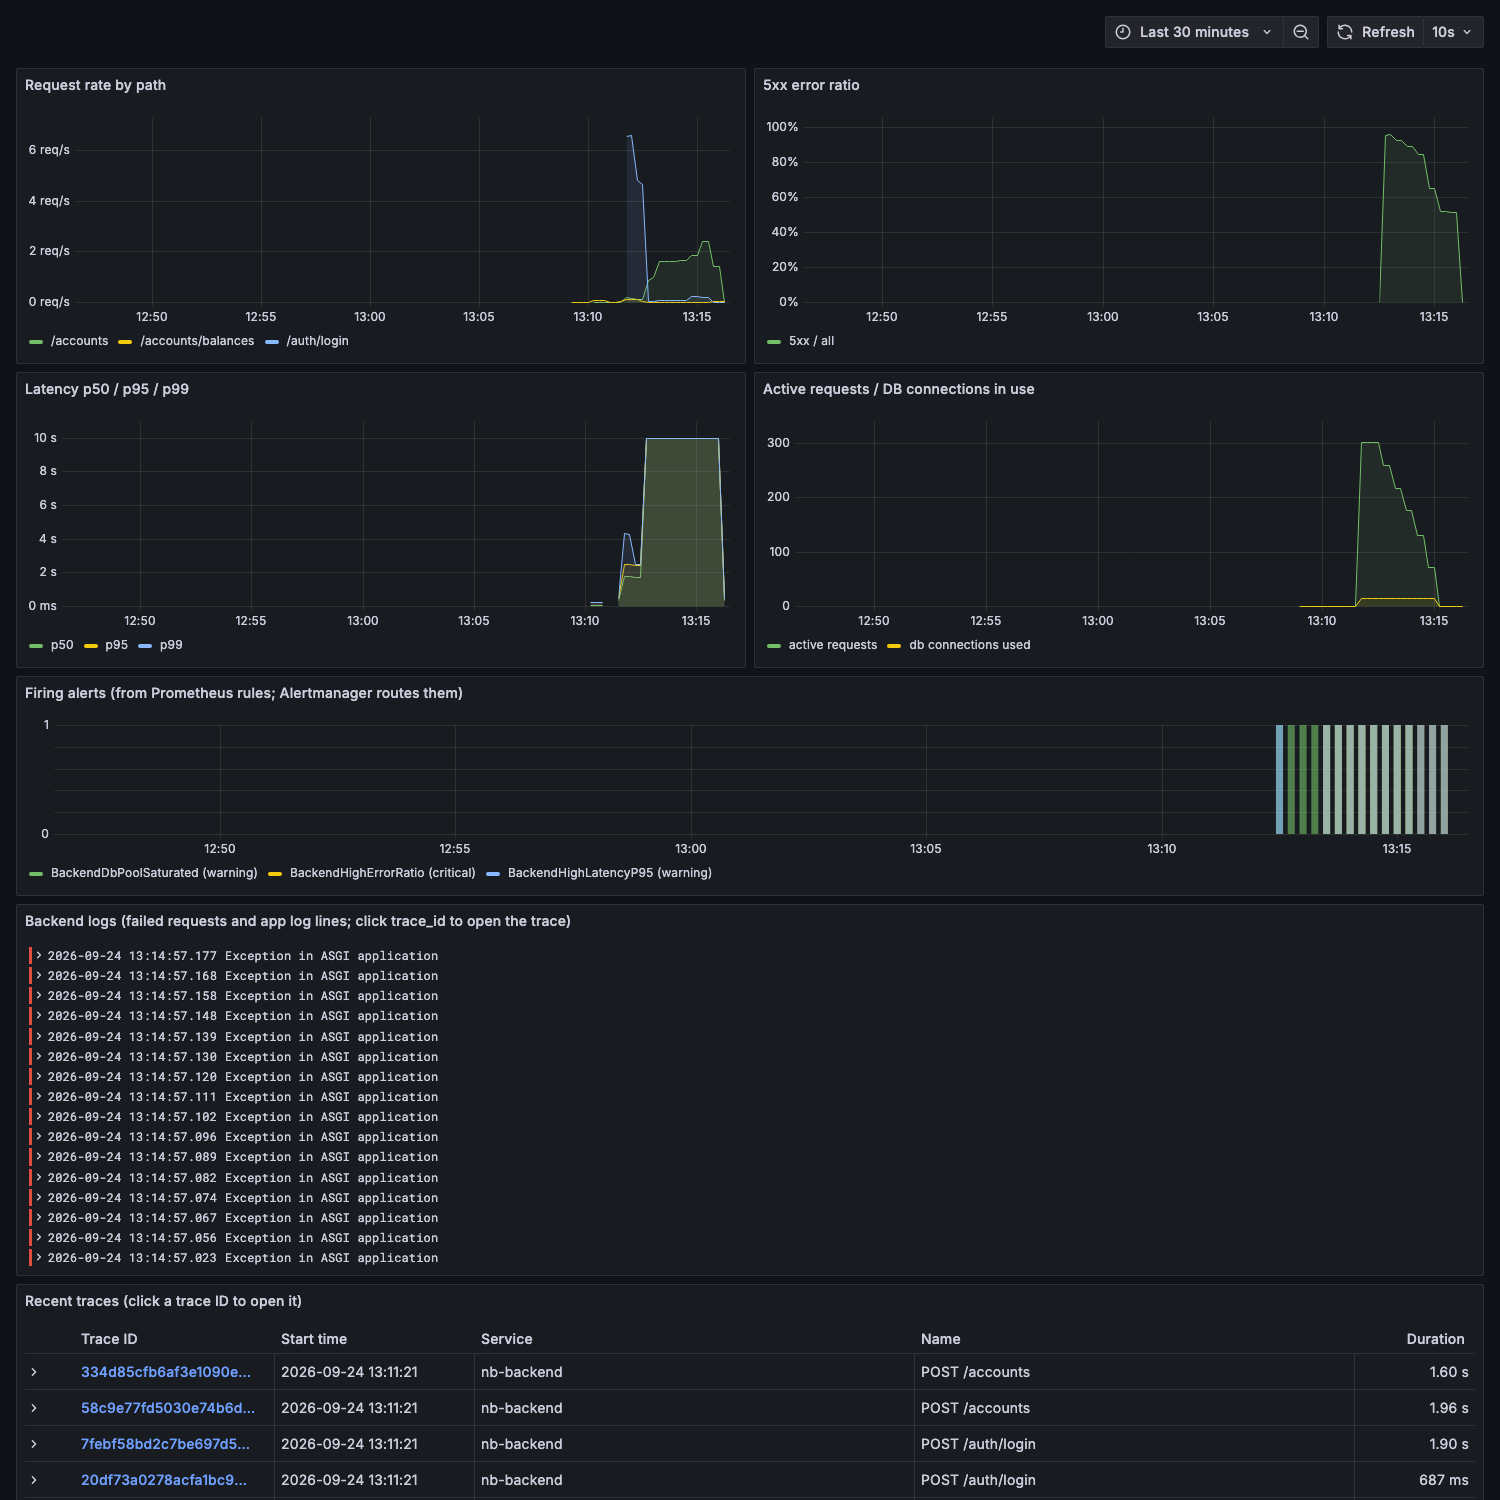
The scenario puts three alert rules into Prometheus: BackendHighErrorRatio (5xx above 5%, critical), BackendHighLatencyP95 (p95 latency above 1s, warning) and BackendDbPoolSaturated (15 DB pool connections in use, warning). Each fires only after the condition has held for 30 seconds, so one noisy sample doesn't trigger it.
What we confirmed: we ran the direct-REST load that failed in Scenario 3 (300 users, 40 seconds) again, this time with Grafana open.
- p95/p99 latency climbed toward the 30-second DB pool timeout, and DB connections in use stayed pinned near the ceiling. Run the same load through Kafka and those panels stay flat
- On the alerts, the two warnings fired first and the critical 5xx alert followed about a minute later. Once it fired, the inhibit rule kicked in, so the on-call person gets one critical alert instead of three
- In Loki we could read the cause of the 5xx spike, with its stack trace: the DB pool was exhausted —
QueuePool limit of size 5 overflow 10 reached, connection timed out, timeout 30.00
Kong's and agentgateway's traces can go to the Collector too. A request that passes through a gateway shows up as a single trace: the gateway's span with the backend's spans, SQL queries included, hanging beneath it.
Scenario 5: Keycloak
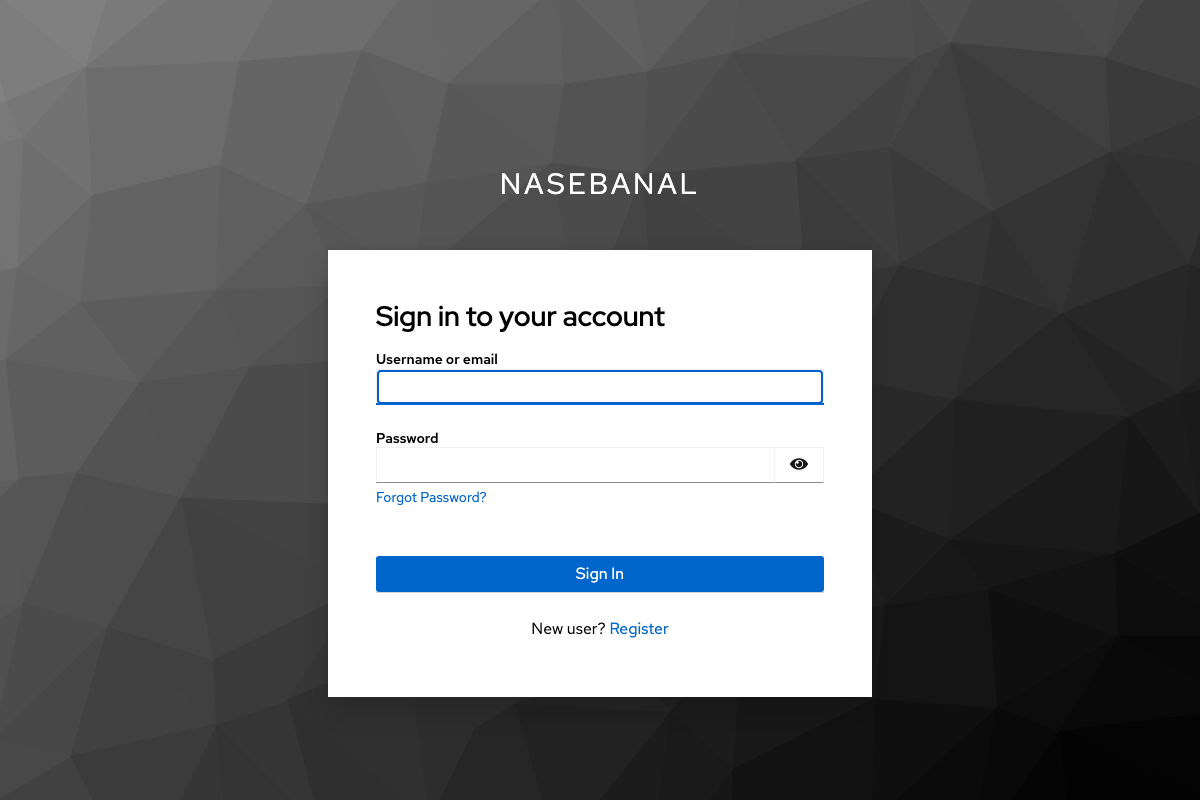
Add a real OIDC login to the login page. The backend verifies the JWT Keycloak issued against its public key, so the backend never handles a password.
- Keycloak — an identity provider for standard OIDC/OAuth 2.0. It handles login, token issuing and SSO so you don't write authentication code yourself. Users, roles and federation with external or enterprise identities are managed in one place, and the same IdP can serve several apps. In this scenario, a fixed realm (
nasebanal) is imported on every start, with a demo user and sign-up (user registration) turned on
The sequence follows the same idea as "Sign in with Google" (an Authorization Code flow with PKCE):
- Frontend → Keycloak: redirect the user to Keycloak's login (or sign-up) page, with a
client_idand acode_challenge - Keycloak: the user signs in here. The app never sees the password
- Keycloak → Frontend: redirect back to
/auth/callbackwith a one-time authorization code - Frontend → Keycloak: send the code and the
code_verifiertoPOST /tokento exchange them for tokens - Keycloak → Frontend: return an access token (JWT)
- Frontend → Backend: call
POST /accountsand the like withAuthorization: Bearer <JWT> - Backend → Keycloak: only on the first request (or after a key rotation), fetch the public keys (
GET /certs, JWKS) and cache them - Backend: verify the signature, issuer and expiry, and return
201 Created, or401if any check fails
The backend doesn't query Keycloak per request; it decides by verifying the signature against the public key alone. The frontend's OIDC handling is written by hand, with no OIDC library: a redirect out, a code back, and one fetch.
What we confirmed: make keycloak:verify-apps checks this without a browser. It gets a real token from Keycloak and calls POST /accounts with it.
$ make keycloak:verify-apps
1. Getting a real access token from Keycloak (realm nasebanal, user keycloak-demo)...
2. Calling the real backend's protected POST /accounts with it...
   HTTP 201

$ curl -X POST localhost:8080/accounts ...            # no token
401
$ curl ... -H "Authorization: Bearer <token, last character changed>"
{"detail":"invalid or missing token"}  401
$ curl ... -H "Authorization: Bearer <genuine token>"
201
The genuine token was accepted, while a request with no token and one whose last character was changed so the signature no longer matches were both rejected with 401. The backend trusts a signature that matches Keycloak's public key, not the contents of the token. In the browser, you can also confirm that a new user who signs up at Keycloak can record a transaction right away, without ever being registered with the backend beforehand.
Scenario 6: Vault
Remove the MySQL password from the backend's config and have it request one from Vault at startup. Vault creates a short-lived MySQL user on the spot and drops it when the lease ends.
- Vault — keeps secrets in one audited store instead of scattering them across
.envfiles, images and CI settings. Access is controlled by policy and token, and every read can be logged. The database secrets engine this scenario uses issues credentials dynamically: instead of handing out a fixed password, it creates a fresh credential on every request and revokes it automatically when the lease (the loan period) ends
The sequence is as follows. Vault holds one privileged MySQL connection (root), configured just once, and the backend holds only a Vault token that is allowed to ask for a credential.
- Backend → Vault: request a database credential with
GET /v1/database/creds/apps-backend(withX-Vault-Token) - Vault → MySQL: using the root only Vault has,
CREATE USERa new user with a random name and password, limited to thedemodatabase - MySQL → Vault: return OK
- Vault → Backend: return the username, the password and a lease (1 hour)
- Backend → MySQL: connect as that user and run SQL (the backend renews the lease at half the TTL, up to the role's 24-hour ceiling)
- Vault → MySQL: when the lease ends or is revoked,
DROP USERremoves that user
What we confirmed: we checked "it doesn't work without Vault" and "it works with Vault", in that order.
First, with the backend's BACKEND_MYSQL_PASSWORD empty and no Vault, the backend can't start and keeps retrying the login (make vault:prove-needs-vault).
[db] attempt 1/30 failed: (pymysql.err.OperationalError) (1045, "Access denied for user 'demo'@'172.20.0.3' (using password: NO)")
[db] attempt 2/30 failed: ... Access denied for user 'demo' ... (using password: NO)
  GET /accounts/balances -> HTTP 000
  (no answer - the backend never came up)
Next, give it Vault, and the backend's own startup log shows the user Vault issued dynamically (make vault:verify-apps).
Password in the backend's environment: '' (empty on purpose)

[vault] issued a dynamic MySQL user v-token-apps-backe-c9wybUj5oXeKe (lease 3600s) from http://vault:8200/v1/database/creds/apps-backend

[{"name":"","balance":7,"eventCount":1},{"name":"Cash","balance":120034,"eventCount":15}]
With the password in its environment left empty on purpose, the backend connected to MySQL as the v-token-apps-backe-... user Vault issued, and real balances came back. Restart the backend again and a second, different user is created (make vault:db-users lists them in MySQL's own mysql.user). Nobody typed that name or password; Vault generated both. One caveat: the Vault used here is an in-memory dev server, and everything, including its lease records, is gone on vault:down — a setup meant only for trying things on your own machine.
Scenario 7: MCP through agentgateway
Instead of writing MCP code in the backend, stand up a gateway that builds MCP tools from the OpenAPI contract, so AI agents can call them.
- agentgateway — turns an existing OpenAPI contract into MCP tools with configuration alone. Sending MCP (and A2A) traffic through one gateway makes it a single place for access control, observability and routing of what AI agents can call. Because the tools come from the same contract as everything else, they follow API changes automatically. It also ships a dashboard UI where you can see which route is wired to which backend
The flow is this: an MCP client (Claude Desktop, mcp-inspector and the like) connects to agentgateway's /mcp over Streamable HTTP, gets the tools with tools/list, and when it calls one with tools/call, agentgateway calls the matching REST API on the backend.
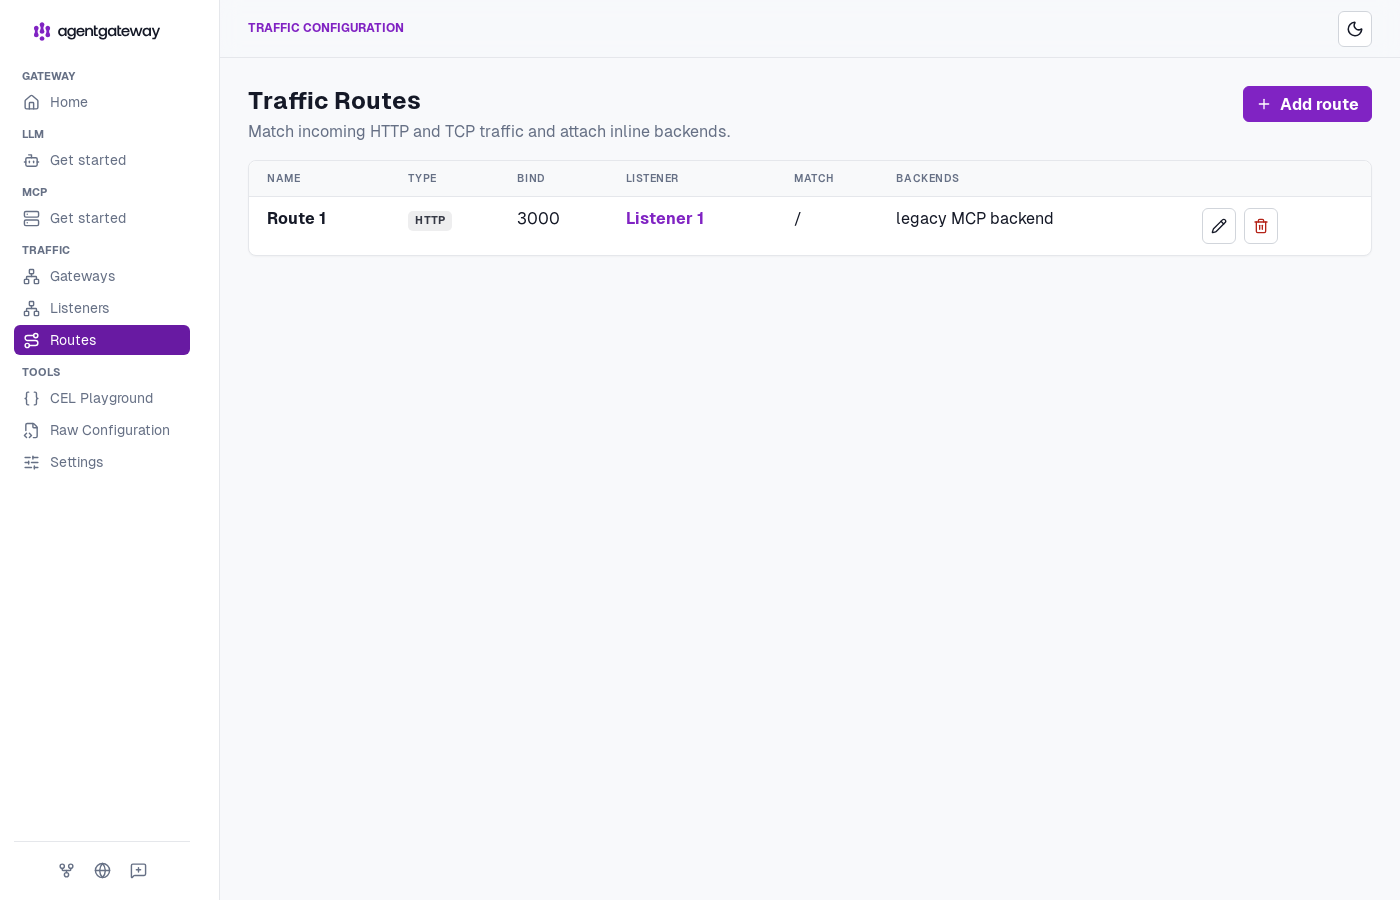
What we confirmed: make agentgateway:tools does the MCP handshake by hand and lists what it serves: six tools, one per operation in openapi.yaml, named and described straight from the contract (health, login, list_accounts, create_account, list_balances and get_account). Calling list_balances through the gateway returns the same live data as GET /accounts/balances itself, so it's a real proxy to the running backend, not a static description. create_account needs a real bearer token, just like the REST call does; without the token you get a 401, unless you call login first and pass its token along.
In Grafana and Tempo from Scenario 4, we could also see tools/call and the backend's REST request and SQL query joined into a single trace, so the MCP call and the REST call can be followed in one place.
Test result reports
These are the reports Scenario 1 leaves behind. All of the test tools run with the same make <module>:test feel and leave an HTML report behind, and the same running apps is tested from every angle: unit, end to end, contract, load and security. The latest results are below.
| Layer | Tool | What it checks | Result |
|---|---|---|---|
| Unit (backend) | pytest | Accounts and balances, password login, profile, Keycloak JWT validation (including forged and tampered tokens) | 22 tests |
| Unit (frontend) | Vitest | The API client, the OIDC PKCE flow, and the resolver that picks the backend to forward to (round robin, fallback to the next instance) | 20 tests |
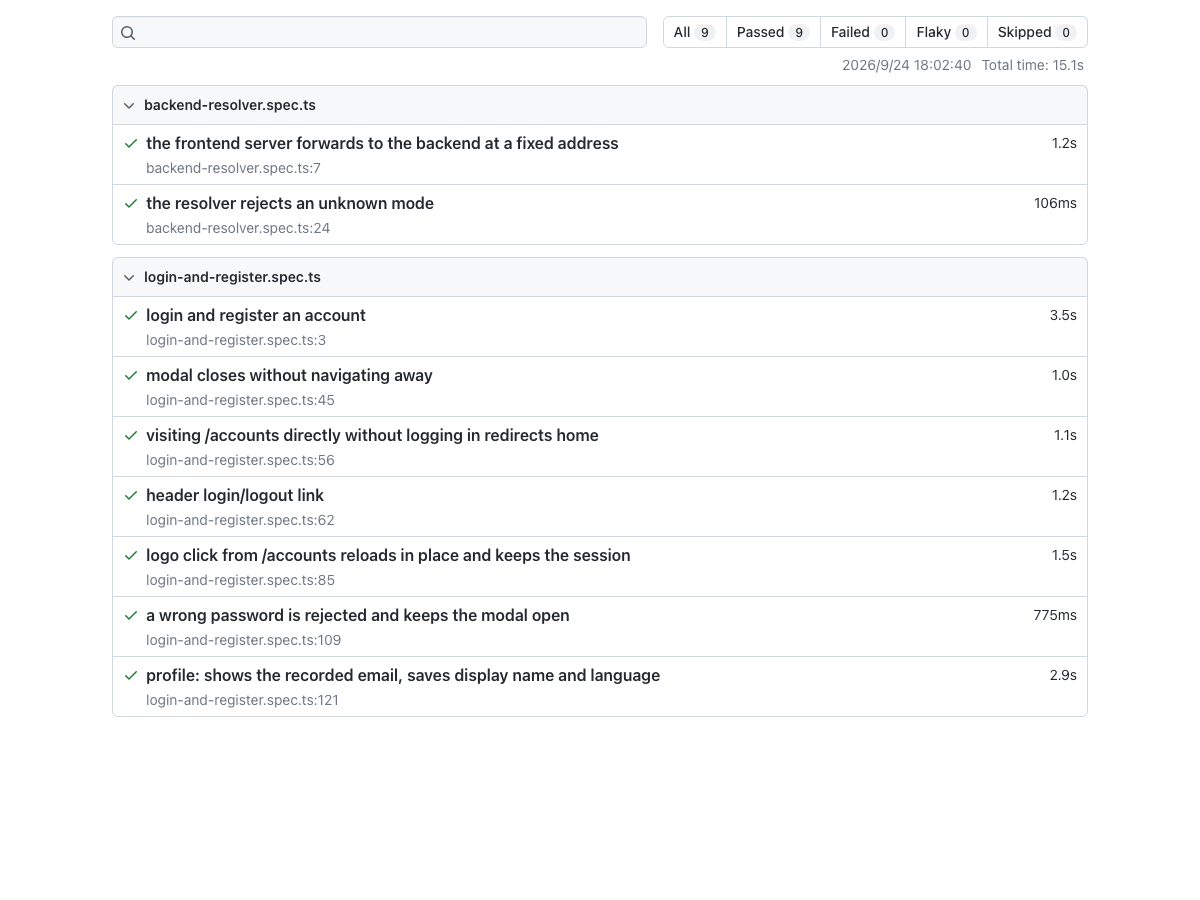
| End to end | Playwright | Login and logout, profile, a wrong password and the resolver API, in a real browser | 9 tests |
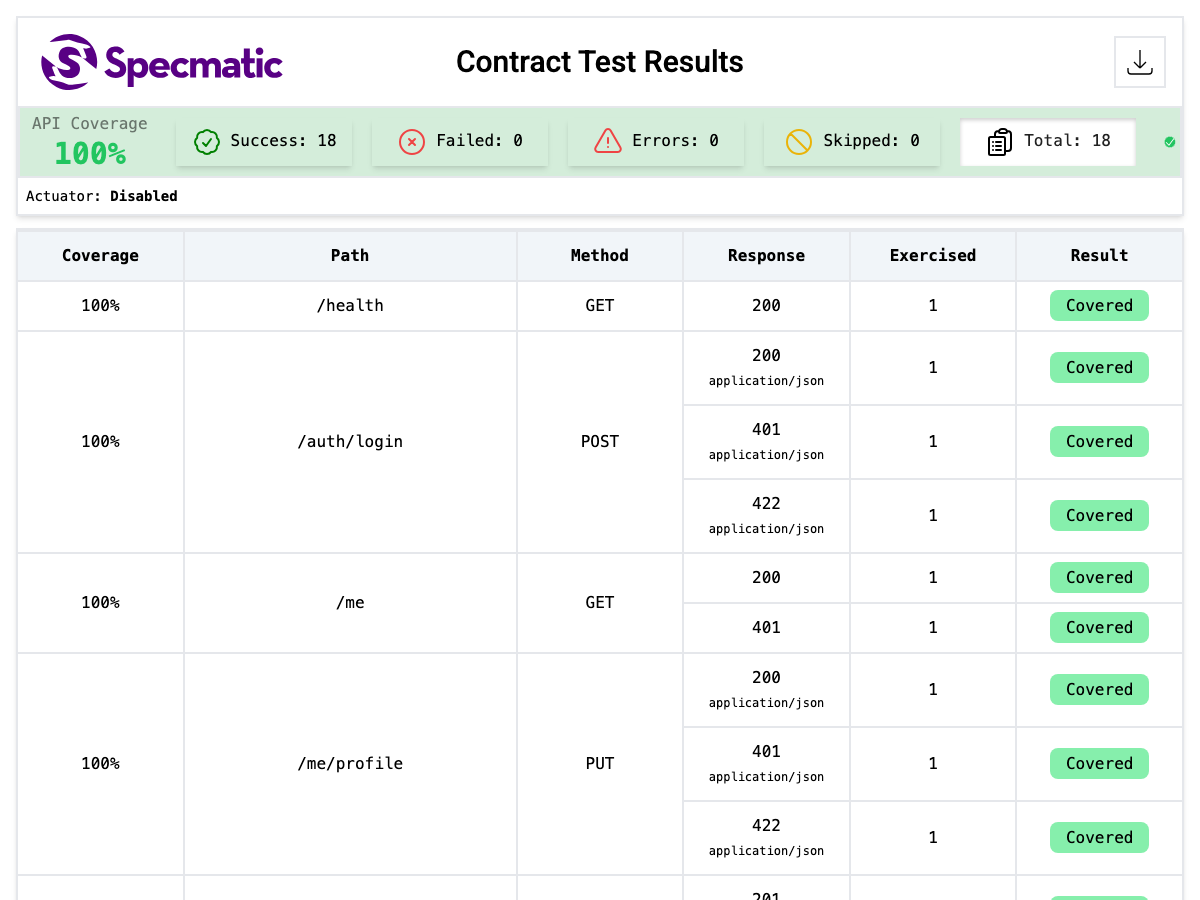
| Contract | Specmatic | Whether the real backend honors openapi.yaml | 18 scenarios, 100% API coverage |
| Contract (second check) | Microcks | The examples in openapi.yaml, sent to the real backend and checked against the schema | 9 examples: 6 pass, 3 findings |
| Load | Locust | HTTP, GraphQL and MySQL, overload, and the same overload via Kafka | Results of Scenarios 3 and 4 |
| Security | OWASP ZAP | A passive scan of the frontend, and an OpenAPI-driven scan of every backend route | No High or Medium alerts |
Below are the report screens these commands actually generated.
Unit tests: pytest and Vitest
pytest swaps MySQL for an in-memory database, so it runs anywhere in under a second (22 tests in 570 ms). Vitest tests the frontend's logic without a browser: the API client, the login's PKCE handling, and the server-side resolver that picks the backend to forward to. Neither needs apps running, so they're the quickest to try first.
End to end and contract: Playwright and Specmatic
Playwright drives the real frontend in a browser against the real backend and MySQL. On a failure, the trace (screenshots, network, console) is one click away.
Specmatic reads openapi.yaml, sends real requests to the running backend, and reports coverage per path, method and response code, including the error responses (401, 404, 422) the happy path never reaches. That openapi.yaml is written by hand, not generated from the code, so it can genuinely disagree with the implementation, which is what makes checking it worthwhile.
Contract, a second check: Microcks
make microcks:test imports the contract the backend serves at /openapi.json (it is openapi.yaml, verbatim) and asks Microcks to run its conformance test. For every named example in the contract, Microcks builds the request, sends it to the real backend, and checks the status code and the body against the example's response and the operation's schema. Nothing is generated: what is tested is exactly what the contract's examples specify. The findings are described under Scenario 1 above.
Specmatic and Microcks read the same openapi.yaml, and both can test the real backend against it. What we saw of how they differ:
| Specmatic | Microcks | |
|---|---|---|
| Implementation | Kotlin; MIT (open-source edition), with the Studio and Insights screens as paid products | Java; Apache-2.0 |
| Run as | A command (CLI or Docker image) | A server (Docker Compose or Kubernetes) |
| Test cases built from | The spec file's definitions, plus any examples supplied | The named examples in the spec file; operations without an example are not run |
createdAt without a time zone offset | Not detected | Detected |
| Mock | One mock server per spec as set up here; generated data; no UI in the open-source edition | Specs imported into a running server; the spec's own examples; a UI and an API catalog |
Load and security: Locust and ZAP
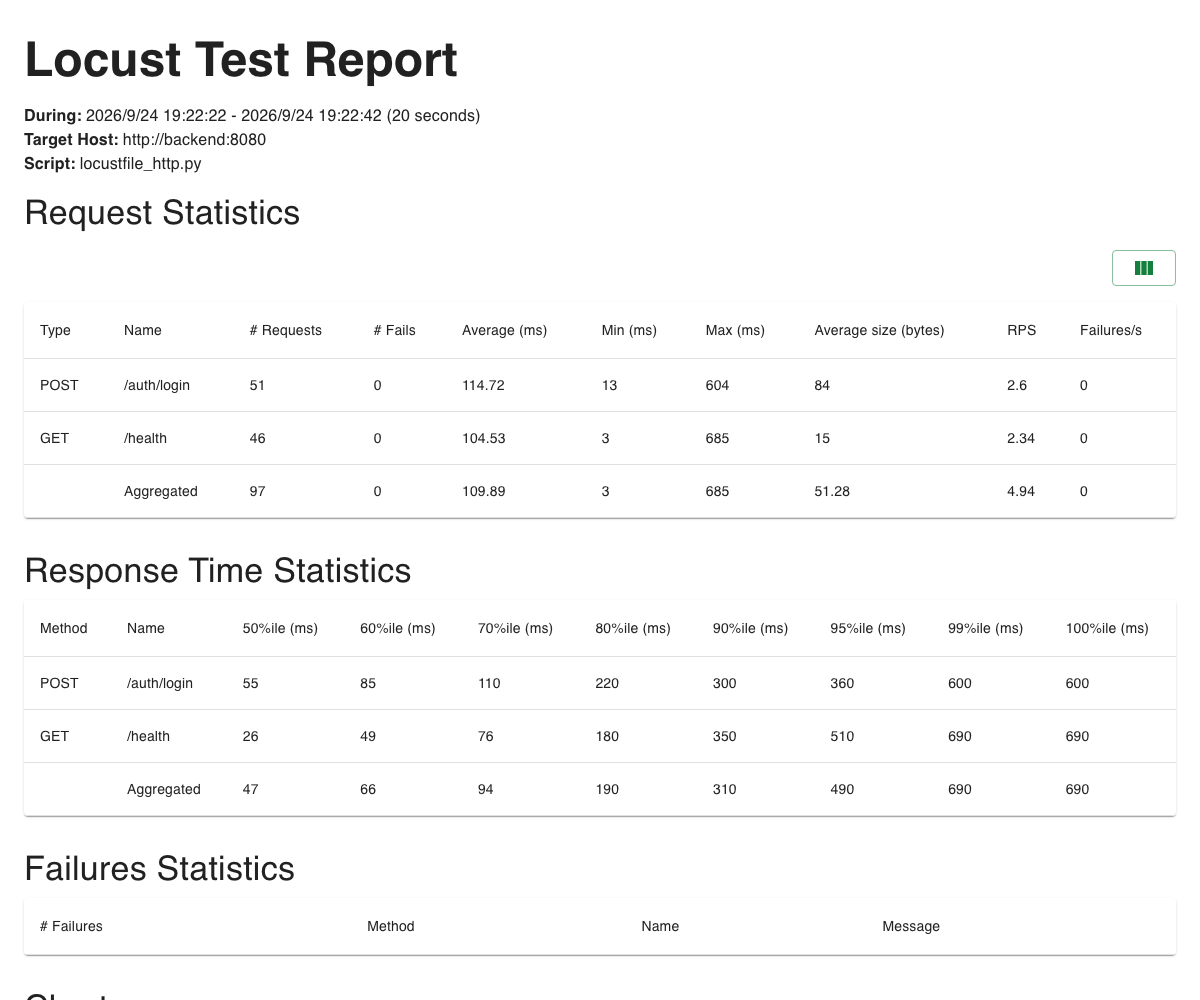
Locust reports response-time percentiles and failures per endpoint (the run below is a short 10-user, 20-second one: 97 requests, 0 failures). The comparisons in Scenarios 3 and 4 are based on this report and its stats history.
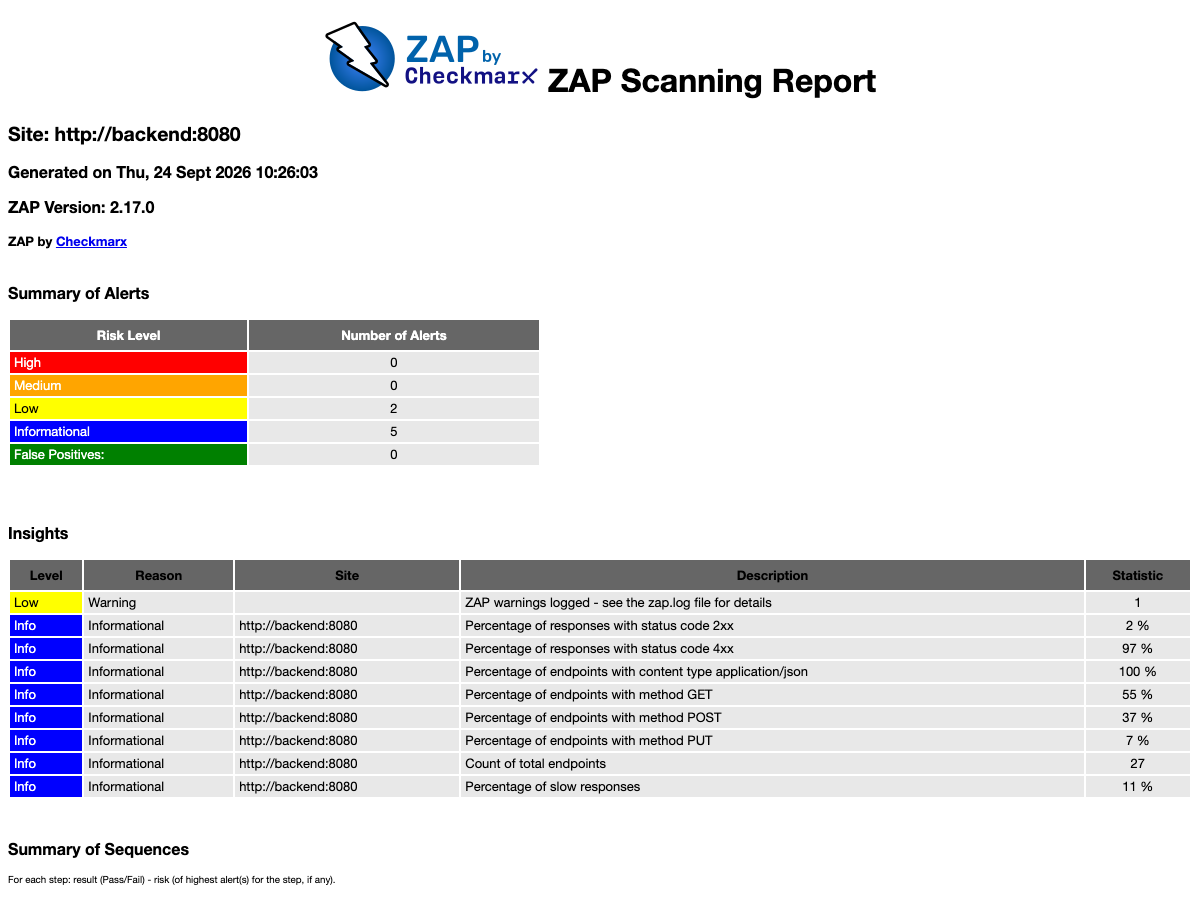
ZAP scans for vulnerabilities. The OpenAPI-driven scan (api-scan) sends real attack payloads to every backend route, so it only ever targets this demo's apps. In this scan of the backend, across 27 endpoints there were no High or Medium alerts (2 Low and 5 Informational), and it passed 116 rules with 0 failures (2 warnings).
For the record, the ZAP baseline scan of the frontend, an unhardened Next.js dev server, passed 52 rules and warned on 15 (mostly missing security headers), with 0 failures. Treat these results as a demonstration of the tooling, not as a security audit.
Every report opens straight in a browser with no server needed, and is regenerated on each run. GitHub's CI runs only the static checks, such as Python and Dockerfile lint and the frontend type check. The tests above need the running stack, so they're run locally.
Summary
NASEBANAL Quickstarts isn't meant to report one particular experiment. It's an entry point for trying the building blocks that are specific to microservices, and the tools that verify them, in a sandbox on your own machine. Being able to run the container operations end to end with simple commands, and to see the interplay between services and tools in seven working scenarios, is what I think sets it apart. And because the results are left behind as test reports, you can look back at what worked and share it afterward.
We plan to keep adding modules and scenarios as the NASEBANAL Stack evolves, and to carry the test results gathered along the way into a mechanism for managing them in one place, which we'll build out as NASEBANAL Evolution.
The steps for each scenario are in the NASEBANAL Quickstarts README and in the docs inside the demo app that make apps:up starts. If you're curious, start with make apps:up.